 ).
).
Indicator Traits
Here, females prefer a certain trait in males because that trait is an indicator of desirable traits that are not directly observable.
Example: Barn Swallows
Here, male tail length is correlated with resistance to parasites.
Females prefer to mate with long tailed males even though the extra tail
length reduces agility while flying.
Example: Stickleback Fish
Females prefer males that have bright red coloring on their sides.
Males with this coloring are resistant to parasitic tapeworms, and this resistance is heritable.
Offspring of bright red males were more resistant to tapeworms than were their half siblings fathered by less red males.
Behavioral Evolution
Recall from earlier in the course that frequency independent selection acts to maximize mean population fitness ().
In the examples of sexual selection, fitness was frequency dependent: meaning that the fitness of an individual depends on the frequency of different strategies in the population.
In general, frequency dependent selection does not maximize .
Example: Sex ratio
Mean population fitness would be maximized by having many females and
only a few males (this would maximize overall reproductive output.)
Despite this, most populations are close to a 1:1 sex ratio.
The key is that if one sex is rarer than the other, then a female that
produces a primarily the rarer sex will on average leave more grandchildren
(since her offspring will easily find mates).
Thus, a 1:1 sex ratio is "Evolutionarily Stable", since selection moves the system towards
it and, once there, nobody could increase her fitness by producing primarily
males or primarily females.
Recall our equation for change in allele frequency, written in terms of marginal fitness values:
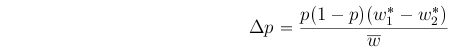
This equation made no assumptions about frequency dependence or independence (that entered in when we rewrote it in terms of the derivative of mean population fitness).
We can therefore use this equation to study the effects of frequency dependent selection by plotting the marginal fitness values as functions of p, and noting that p will increase when w1* > w2*, and decrease when w1* < w2*
Example: Consider a hypothetical allele that increases individual reproductive rate, but also leads to the production of a waste product that harms all individuals in the local environment.
In this case, everyone's fitness declines as p increases, so we might have genotypic fitness values like this:

Using these, we find the marginal fitness functions to be:

And the mean population fitness to be:

Plotting these as functions of p, we see that w1* > w2* for all values of p, so p keeps increasing towards 1.

Note, though, that at p = 1, mean population fitness is actually minimized, since the toxic waste product is being produced at a maximal rate.
We thus can not use fitness maximization as a criteria to determine what will happen in evolution when fitness is frequency dependent. Instead, we use evolutionary stability.
Note that, in principle, selection within a population could thus lead the population to evolve to such a low value of that it goes extinct.
Evolutionarily Stable Strategy (ESS)
A strategy (or set of strategies) with the property
that a rare variant strategy can not increase in frequency.
Alternately, A state in which all strategies have
the same fitness and nobody could increase their fitness by switching to
another strategy.
The ESS is the central concept of Evolutionary Game Theory.
The ESS approach was originally used to study the evolution of animal
conflicts.
Many animals have some sort of "ritualized combat", in which individuals
fight but do not use deadly force.
Examples include "jousting" matches between male deer (who could potentially
gore one another much more severely than they usually do), and "wrestling"
between male pit vipers (who could use their fangs, but don't).
Maynard Smith and Price (1973) set out to try to understand how a strategy that does not use deadly force could evolve.
Considered a case in which two organisms compete for a valuable resource.
If one gets the resource, it gains benefit B. However, if it is injured while fighting
it incurs cost C.
Considered two strategies (actually considered 5, but these are the interesting
ones):
- Hawk: Always fight until it wins or is injured.
- Mouse: retreat if the opponent starts to fight.
These are the possible outcomes of one contest:
We can summarize these values in a "Payoff Matrix"

Define p = frequency of the Hawk strategy.
So 1-p = frequency of the Mouse strategy.
Assuming that any individual would have fitness 1 before the contest, we can write the expected fitness (payoff) values for the two strategies.
WH = 1 + 1/2*(B-C)*p + B*(1-p) (Equation 1)
WM = 1 + 1/2*B*(1-p)
(Equation 2)
Now consider the case where B = 1 and C = 2.
Substituting these values into Equations 1 and 2 yields:
WH = 2 - 1.5*p
WM = 1.5 - 0.5*p
To see what happens in this case, we plot WH and WM together:

Note that in this case, the ESS is 50% Hawk and 50% Mouse. This can mean either that half of the individuals play each strategy, or that each individual plays each strategy half of the time.
If everyone played the Hawk strategy, then an individual that used the Mouse strategy would do better, and so Mouse would increase in frequency.
Conversely, if everyone played the Mouse strategy, then Hawk could invade and increase in frequency.
This thus represents a case in which, at evolutionary equilibrium, organisms do not always use force, even when they have the ability to.
If, at the ESS, everyone plays the same strategy, then we call it a "Pure strategy ESS".
Conversely, if, at equilibrium, different strategies coexist, we call it a "Mixed strategy ESS".
A pure strategy ESS is the best response to itself.
Matrix games
We can identify pure strategy ESSs directly from the payoff matrix.
The numbers on the diagonal of the matrix are the payoffs for each strategy against itself.
Since a pure strategy ESS is the best response to itself, the number on the diagonal for that strategy will be larger than any of the other values in that column (since these describe how other strategies do against that strategy).
Jul 8, 2021