
Fall 2017 Newsletter

Proposed Revisions to SACSCOC Principles
SACSCOC has spent the last 18 months reviewing comments and input from its member institutions regarding the 2012 Principles of Accreditation. The SACSCOC Board of Trustees approved the revised Principles of Accreditation as its annual June 2017 meeting. These revised principles will be considered by the College Delegate Assembly at the December Annual Business Meeting. If approved, the Principles will become effective January 1, 2018. These revisions have significant implications for all SACSCOC- member revisions, including Texas Tech.
Here is a sampling of the new revisions that will affect Texas Tech:
- Significant changes to institutional effectiveness requirements, including the addition of administrative outcomes.
- A new standard has been created that says we must provide "information and guidance to help student borrowers understand how to manage their debt and repay their loans."
- A revised standard that is now included in the Fifth Year Interim Report that asks us to prepare evidence to show that we maintain a safe and secure environment on our campus.
OPA is closely monitoring all revisions to the Principles, and we will continue to keep the TTU campus community informed.
Raiders Engaged Update
The 2017 Raiders Engaged administration is now open! Raiders Engaged is Texas Tech University's (TTU) annual assessment of outreach and engaged scholarship and will be open through December 1, 2017 to gather faculty and staff outreach and engaged scholarship activities. OPA encourages all faculty to participate in the survey as it provides the institution with valuable data toward its strategic priority of furthering engagement with external constituents.
Engagement occurs when faculty or staff members' research, teaching, administrative, or service activities significantly engage their scholarly or professional expertise with communities and/or organizations outside the university with the direct goal of improving outcomes for those who live and work in them. We invite you to report any teaching, research, or service projects or activities that you conducted for or in partnership with external communities during the 2016-2017 academic year. "Communities" are broadly defined as any individuals or organizations outside of the university that you may have worked with in your institutional role, to help address a need or specific issue. These could be non-profit or government agencies, business and industry, K-12 schools, 2- or 4- year institutions, community organizations, civic groups, and others.
Raiders Engaged has undergone a number of improvements, most notably including the ability to prepopulate and edit previously submitted data for ongoing projects. Data submitted in Raiders Engaged will also be uploaded into faculty DigitalMeasures accounts in time for faculty annual reviews, cutting down on the amount of time faculty spend reporting such data while also allowing the University to collect a more representative picture of outreach and engaged scholarship activity within TTU. In addition, we wish to recognize faculty and staff accomplishments in engaged research, teaching, and service.
Historically, Raiders Engaged has seen annual growth in participation rates, but as more widespread participation is seen from TTU departments, we expect to see continued growth in both new initiatives and ongoing projects that have not been collected before. For instance, Raiders Engaged saw an increase of 186 projects reported from 2015 to 2016. The table below summarizes the findings from the 2016 Raiders Engaged administration by college.
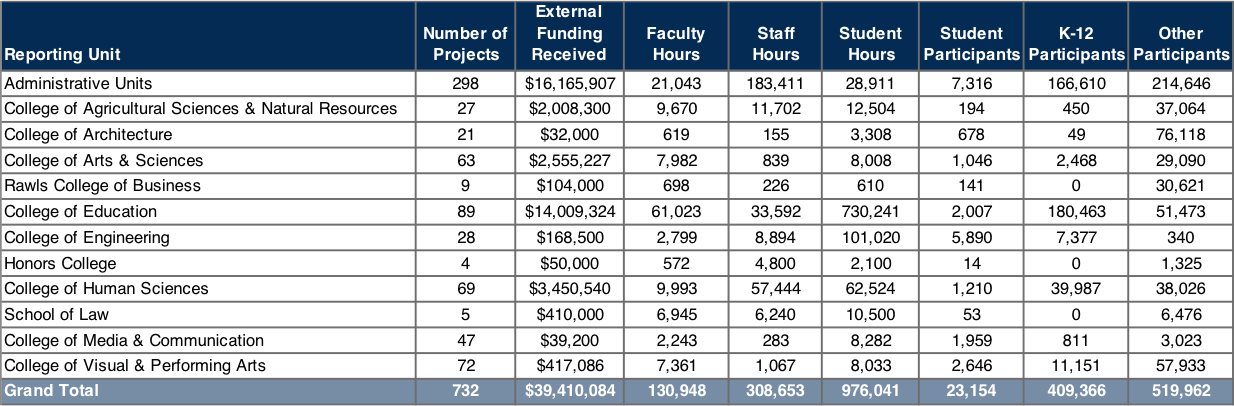
You may also view the full 2016 Raiders Engaged Summary in a new online format, as well as downloadable PDF.
For questions about Outreach and Engagement you may contact Dr. Birgit Green, Director of Academic Engagement, at birgit.green@ttu.edu. For survey related questions, you may contact Libby Spradlin, Lead Administrator for the Office of Planning and Assessment, at libby.spradlin@ttu.edu.

Data Quality
Data quality in DigitalMeasures (DM) is based on departmental scores metrics, target, and weight as determined by DM. Four factors contribute to quality data:
-
- Accuracy: determined by individual user; not used in calculation of data quality
- Completeness of "core screens": screens, fields and dates that provide the bulk of content
- Consistency: similar activities are entered in the same way and in the same place
- Currency: data is up-to-date (within the last four months)
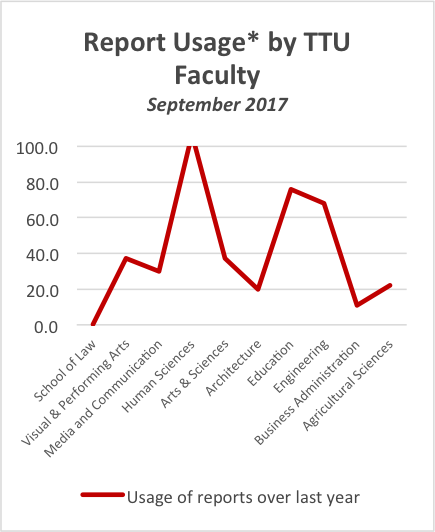
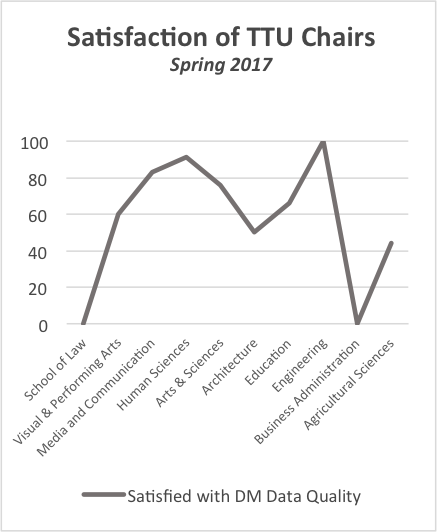
The Office of Planning and Assessment (OPA) at Texas Tech University has been working on "cleaning up" DM accounts since spring 2017. This was needed to get a more accurate measure of DM data quality. We also wondered if the quality of DM data could be related to satisfaction of TTU Departmental Chairs with the DM report usage by faculty. Here is what we found out.
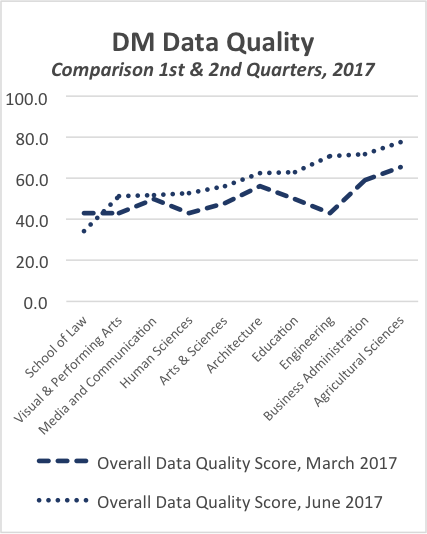
With the above information at hand, we wondered if we could draw any preliminary conclusions. Would this data provide any information that could assist OPA as we work with units across campus in efforts to improve data as well as satisfaction with DM quality and could this lead to improved usage? We fully recognize this is raw data and is not filtered; more data is needed to draw definite conclusions. However, we believe varying levels of engagement begin to emerge.
The following graphic attempts to overlay the three earlier images and provides a clue about units that may need assistance to make DM data as useful as possible.
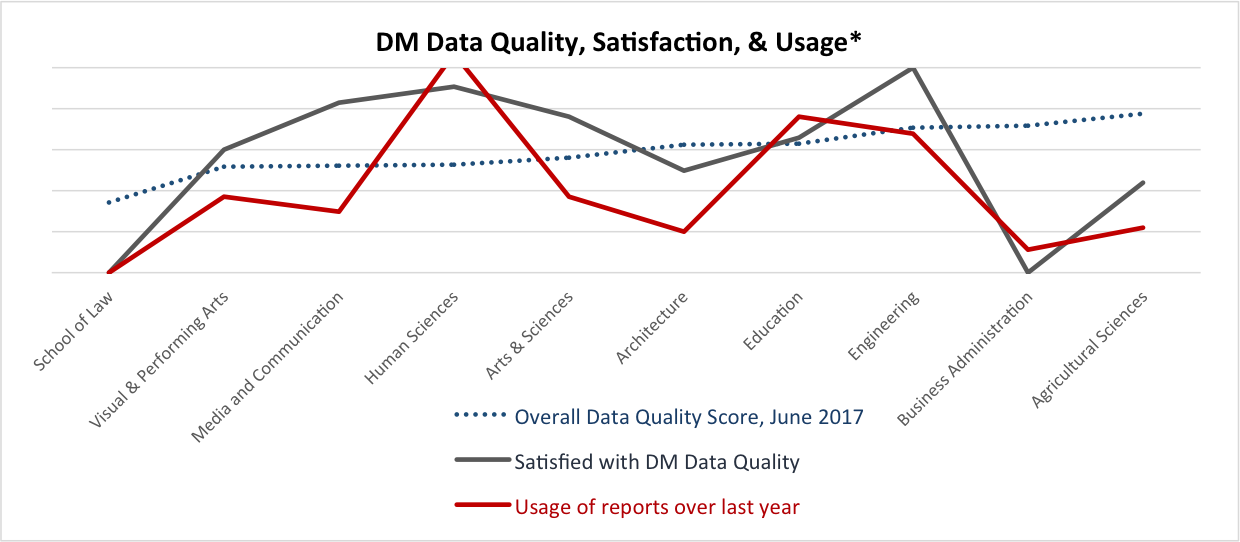
OPA staff are beginning to share this information and address areas of concern. We look forward to continued study and evaluation with hope of assisting all units across campus, and the institution as a whole, as faculty credentialing data found in DigitalMeasures becomes more valuable and informative.
*Report usage is calculated by # of reports pulled by number of users in each college and is multiplies by 10 to allow display on a 100-pt. scale.
Office of Planning and Assessment
-
Address
Administration Building, Suite 237, Box 45070 Lubbock, TX 79409-5070 -
Phone
806.742.1505 -
Email
opa.support@ttu.edu