
Atlas of Rural and Community Health

Demographic Trends
Map Title |
JPEG |
|
Metadatata |
||||
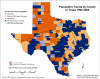 |
Population Trends By County in Texas 1900 - 2000 |
|
|
|
|||
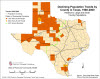 |
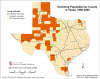
Declining Population Trends By County in Texas 1980 - 2000 |
|
|
|
|||
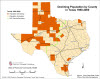 |
Declining Population By County in Texas 1980 - 2000 |
|
|
|
|||
 |
Population Trends 1980 - 2000 |
|
|
|
|||
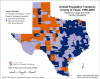 |
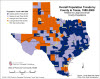
Overall Population Trends By County in Texas 1990 - 2000 |
|
|
|
|||
 |
Declining Population By County in Texas 1990 - 2000 |
|
|
|
|||
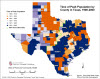 |
Decades of Peak Population by County in Texas, 1900 - 2000 |
|
|
|
|||
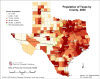 |
Population of Texas by County: Census 2000 |
|
|
|
|||
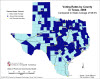 |
2008 Voting Rates by Texas County (Compared to State Average) |
|
|
|
|||
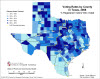 |
2008 Voting Rates by Texas County (%registered voters who voted) |
|
|
|
|||
))
))
))
))
))
))
))
))
))
))