
Atlas of Rural and Community Health
Demography
Map Title |
JPEG |
|
Metadatata |
||||
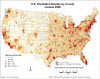 |
U.S. Population Density By County, 2000 |
|
|
|
|||
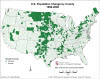 |
U.S. Population Change By County, 1990-2000 |
|
|
|
|||
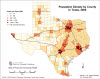 |
Texas Population Density By County, 2000 |
|
|
|
|||
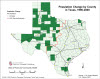 |
Texas Population Change By County, 1990-2000 |
|
|
|
|||
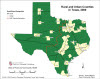 |
Rural and Urban Counties, 2000 |
|
|
|
|||
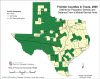 |
Frontier Counties in Texas, 2000 |
|
|
|
|||
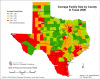 |
Average Family Size, 2000 |
|
|
|
|||
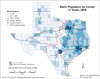 |
Black Population by County, 2000 |
|
|
|
|||
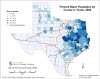 |
Percent Black Population by County, 2000 |
|
|
|
|||
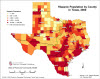 |
Hispanic Population by County, 2000 |
|
|
|
|||
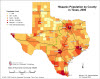 |
Hispanic Population by County - Urban Classification, 2000 |
|
|
|
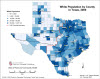 |
White Population by County, 2000
|
|
|
|
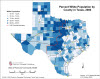 |
Percent White Population by County, 2000
|
|
|
|
|||
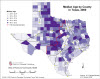 |
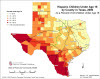
Median Age, 2000
|
|
|
|
|||
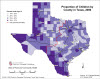 |
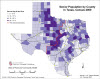
Proportion of Children in Texas Counties, 2000
|
|
|
|
|||
 |
Percent Hispanic Children (Under 18), 2000
|
|
|
|
|||
 |
Senior Population by County, 2000
|
|
|
|
|||
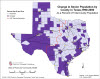 |
Change in Senior Population, 2000
|
|
|
|
|||
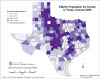 |
Elderly Population by County, 2000 |
|
|
|
|||
))
))
))
))
))
))
))
))
))
))
))
))
))
))
))
))
))
))
))