
Healthcare Engineering
Osteoporosis
Osteoporosis is a major public health problem in the elderly with the highest occurrence rate in postmenopausal women. It causes primarily hip and spine fractures leading to high morbidity and mortality. Osteoporosis is due to a metabolic imbalance featuring faster bone resorption (loss) than formation, resulting in loss of bone tissue and structural changes, and causing a high susceptibility to fracture. Collaborating with Texas Tech University Health Sciences Center School of Medicine, we have been conducting animal and human research to explore various methods of osteo-protective interventions targeting bone loss.
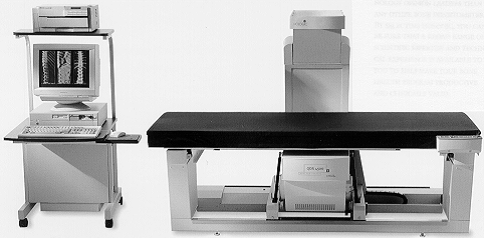
Bone Density Measurement by Dual Energy X-Ray Absorptiometry
Dual energy x-ray absorptiometry (DXA) bone densitometer (see figure below) uses two different energy levels produced by an energy tube to measure bone mineral density (BMD), total bone area, and bone mineral content (BMC).
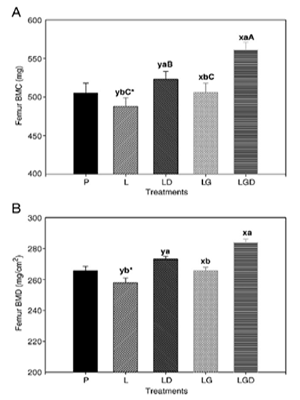
The figure below shows our BMC and BMD data of femur of female rats supplemented with green tea polyphenols in drinking water or 1-α-OH vitamin D3 (D3) administration for 12 weeks. Values are mean with standard error of mean (SEM) represented by vertical bars. Having different letters (x and y for GTP effect; a and b for D3 effect; capital letters for interaction effect) are significantly different by two-way ANOVA and Fisher's LSD test (P < .05). *Significantly different from the P group (between the L group and the P group) based on t test, P < .05. P: placebo. L: lipopolysaccharide (LPS). LD: LPS + 1-α-OH-vitamin D3. LG: LPS + green tea polyphenols (GTP). LGD: LPS + GTP + 1-α-OH-vitamin D3.
Bone Microarchitecture Assessment by Histomorphology
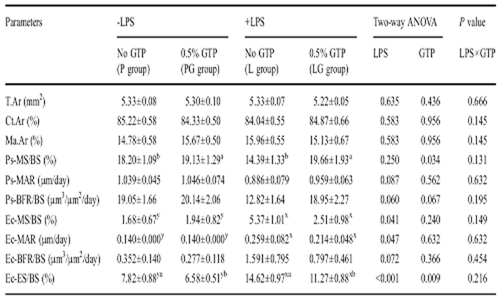
The risk for fracture of bone cannot be fully evaluated by BMD and BMC measurements using DXA. The quality of bone can be further investigated by assessing its microarchitecture through histomorphometric analysis using a digital morphometric system consisting of an epifluorescence microscope, a computerized Osteomeasure High Resolution Color Subsystem, and a morphometry program to measure cancellous bone parameters including total tissue volume, bone volume, bone surface, single- and double-labeled surfaces, interlabel width, osteoclast surface, osteoclast cell number, and eroded surface. These measurements are used to calculate standard morphometric parameters for bone, including cancellous bone volume, trabecular thickness, trabecular number, trabecular separation, trabecular bone-formation rate, and eroded surface/bone surface. Measurements in cortical bone included periosteal mineral total bone area, periosteal perimeter, marrow area, endocortical perimeter, periosteal and endocortical single and double-labeled perimeters, interlabel widths, and endocortical eroded surface. These measures were then used to calculate cortical bone area, marrow area, periosteal mineralized surface/bone surface, periosteal mineral apposition rate, periosteal bone-formation rate, endocortical mineralized surface/bone surface, endocortical mineral apposition rate, endocortical bone-formation rate, and endocortical eroded surface/bone surface. The table below shows our data of histomorphometric measurement in cortical bone of tibia shaft in placebo (P) and lipopolysaccharide (LPS)-administered female rats supplemented with green tea polyphenols (GTP) in drinking water for 12 weeks. Results are expressed as mean values SEM. Treatments were analyzed by two-way ANOVA to evaluate the effects of LPS administration, GTP supplementation, or interaction. Significant interactions between LPS and GTP were tested using Fisher's LSD tests to further define treatment effects. The level of significance was set at P < 0.05 for all statistical tests. Within a row having different superscripts (x and y for LPS effect; a and b for GTP effect; capital letters for interaction effect) are significantly different by two-way ANOVA and Fisher's LSD test (P < 0.05). T.Ar: total area. Ct.Ar: percent cortical bone area (cortical area/total area). Ma.Ar: percent marrow area. Ps-MS/BS: percent periosteal mineralized surface/bone surface. Ps-MAR: periosteal mineral apposition rate. Ps-BFR/BS: periosteal bone formation rate. Ec-MS/BS: percent endocortical mineralized surface/bone surface. Ec-MAR: endocortical mineral apposition rate. Ec-BFR/BS: endocortical bone formation rate. Ec-ES/BS: endocortical eroded surface/bone surface.
Bone Microarchitecture Assessment by Micro Computed Tomography
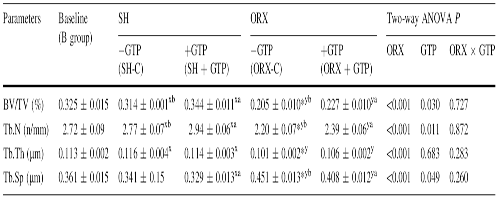
Bone microarchitecture of bone (e.g., vertebral body, femur) can be analyzed by micro computed tomography (CT) which uses X-ray to create cross-sectional images for reconstruction of three-dimensional images of the internal structure of an object. The table below shows our CT data for trabecular femur of sham-operated (SH) and orchidectomized (ORX) rats supplemented with green tea polyphenols (GTP) in drinking water. Results are expressed as mean values SEM, n = 10. BV/TV: percent trabecular bone volume. Tb.Th: trabecular thickness. Tb.N: trabecular number. Tb.Sp: trabecular separation. B: baseline. SH-C: sham control. SH+GTP: sham treated with GTP supplement. ORX-C: ORX control. ORX+GTP: ORX treated with GTP supplement. *Significantly different from the B group (B vs. SH-C; B vs. ORX-C) based on t-test, P < 0.05. Different letters (x and y for ORX effect, a and b for GTP effect) are significantly different by two-way ANOVA and Fisher's LSD test (P < 0.05)
Bone Strength Measurement by Three-Point Bending Test
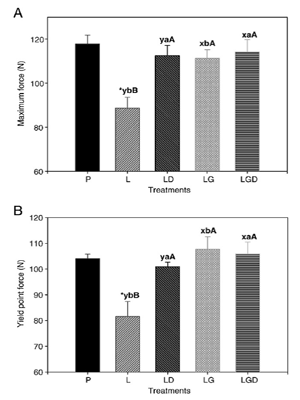
Femoral strength is evaluated by three-point bending test to determine the maximum force and yield point force to break bones as well as modulus of elasticity. The figures below exhibit our data of maximum force (A) and yield point force (B) of femur in lipopolysaccharide (LPS)-administered female rats supplemented with green tea polyphenols (GTP) in drinking water or 1-α-OH vitamin D3 (D3) administration for 12 weeks. Values are mean (n = 10) with their standard error of mean (SEM) represented by vertical bars. Bars having different letters (x and y for GTP effect; a and b for D3 effect; capital letters for interaction effect) are significantly different by two-way ANOVA and Fisher's LSD test (Pb.05). *Significantly different from the P group (between the L group and the P group) based on t-test, P < .05. P: placebo. L: lipopolysaccharide (LPS). LD: LPS + 1-α-OH-vitamin D3. LG: LPS + green tea polyphenols (GTP). LGD: LPS + GTP + 1-α-OH-vitamin D3.
Department of Mechanical Engineering
-
Address
Texas Tech University, Box 41021 | Lubbock, TX 79409 -
Phone
806.742.3563 -
Email
mechanical.engineering@ttu.edu