
Seymour-Knox City Severe Wind Event
On the evening of April 29, 2025, a cluster of storms moved east off the Caprock and into North Texas. As they tracked along a cold front, they gradually intensified, producing strong winds, heavy rain, and large hail. Some of these storms developed into supercells—rotating storms with the potential to spawn tornadoes. However, as the cold front pushed southward, cold air undercut the storms, likely preventing tornado formation. The Storm Prediction Center (SPC) had issued an Enhanced Risk for the area, primarily due to the threat of damaging winds and large hail (Figure 1).
 Figure 1: SPC Convective Outlook for 12:00 UTC April 29, 2025 to 12:00 UTC April 30,
2025
Figure 1: SPC Convective Outlook for 12:00 UTC April 29, 2025 to 12:00 UTC April 30,
2025
One storm in particular became dominant as the afternoon progressed, tracking east from near Lubbock, TX, toward Wichita Falls, TX, along the cold front. As it approached the eastern edge of the West Texas Mesonet’s (WTM) coverage area, the storm reached peak intensity. Two mesonet stations—Knox City and Seymour—were directly impacted, capturing high-resolution 5-Hz data that provided a detailed look at the storm’s behavior. Figure 2 shows an animation of the storm as it tracks over these stations.
 Figure 2: Reflectivity animation of the storm as it impacted the Knox City and Seymour
mesonet stations.
Figure 2: Reflectivity animation of the storm as it impacted the Knox City and Seymour
mesonet stations.
The Knox City station was the first to be hit. Winds increased rapidly—from an average of 17 mph to 55 mph in just 3 to 4 minutes. The peak wind gust, recorded at approximately 23:17 UTC, was 92 mph (Figure 3). Throughout the wind event, the wind direction remained predominantly northwesterly (Figure 4). Given this wind direction and the location of the heaviest precipitation, it is likely these intense gusts were caused by the storm's downdraft.
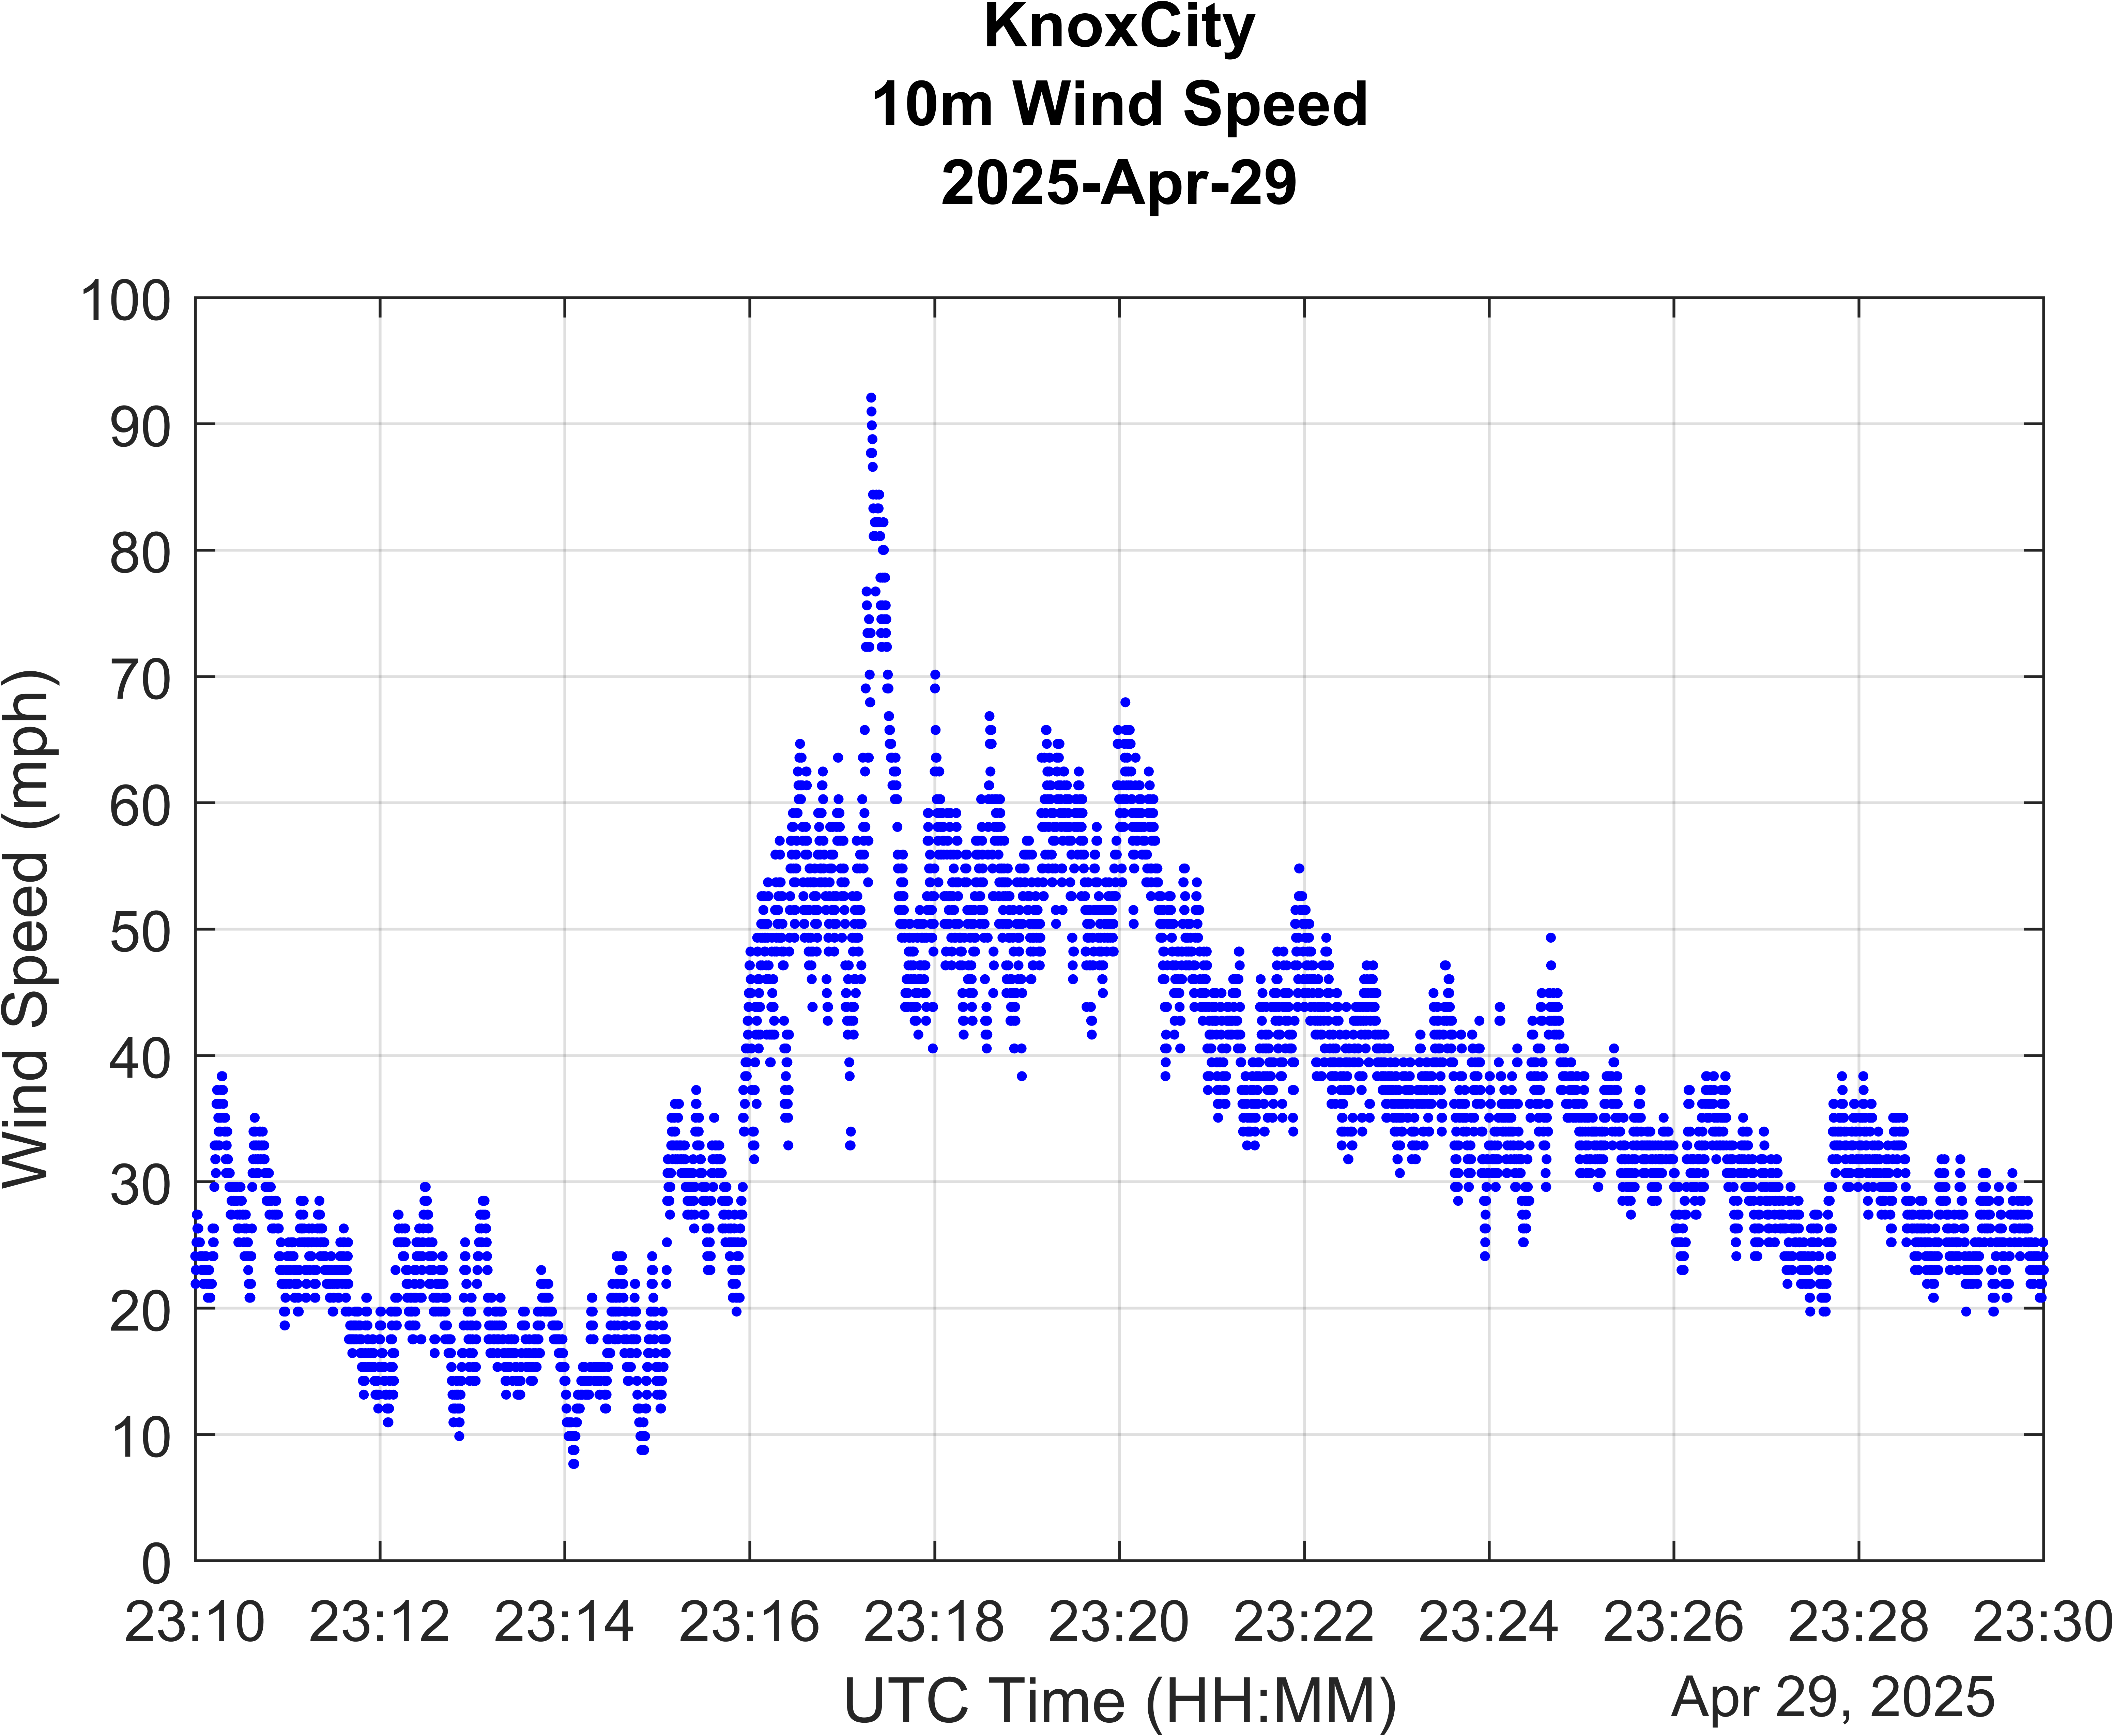 Figure 3: Wind speed time history from the Knox City mesonet station.
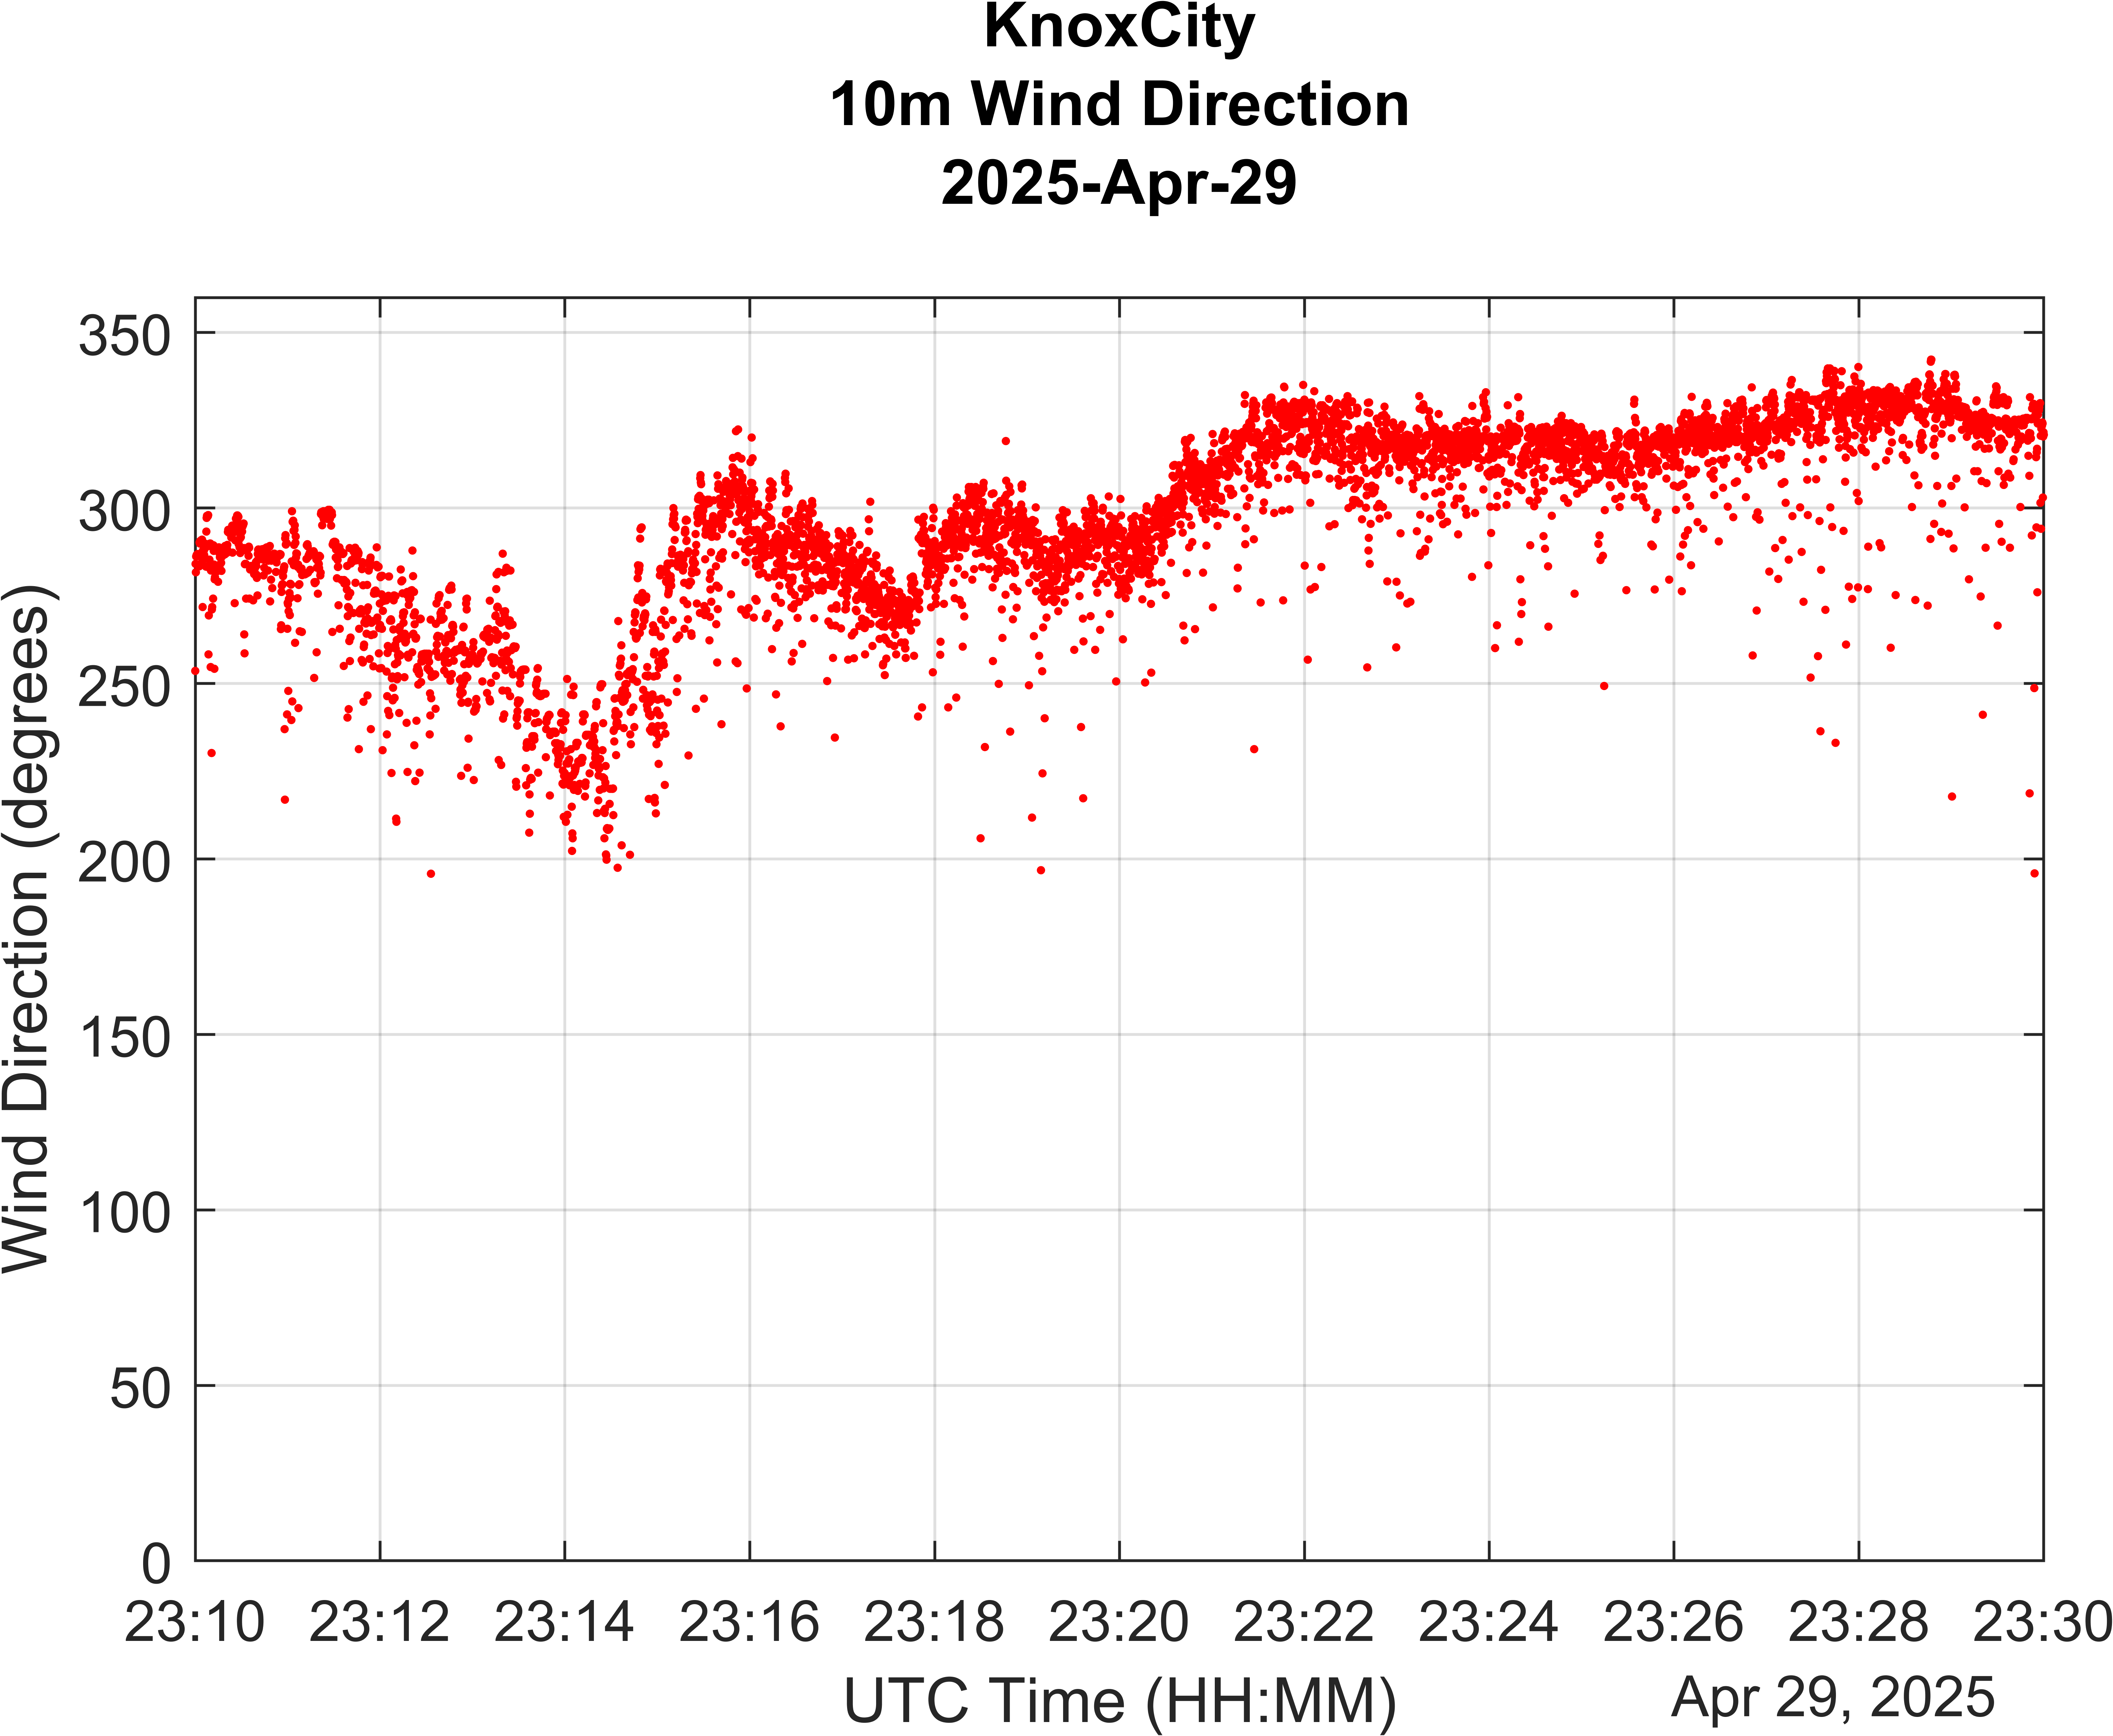 Figure 4: Wind direction time history from the Knox City mesonet station.
Next in the storm's path was the Seymour mesonet station. Radar data (Figure 5) revealed a classic signature of storm rotation—possibly indicative of a tornado—passing just north of the station. Despite not taking a direct hit from the rotation, the station recorded impressive data. Winds jumped from around 20 mph to 70 mph within minutes, with numerous gusts exceeding 90 mph shortly after. The peak gust reached 106 mph (Figure 6).
This extreme wind event was accompanied by a sharp pressure drop—about 6 millibars in just 15 minutes (Figure 6). During this time, wind direction shifted quickly from easterly to southerly, then to northerly, as the rotating portion of the storm passed north of the station (Figure 7). The strongest gusts occurred with the northerly winds, suggesting the 106 mph gust was associated with the storm’s rear flank downdraft.
 Figure 5: Radial velocity animation of the storm as it impacted the Knox City and
Seymour mesonet stations.
Figure 5: Radial velocity animation of the storm as it impacted the Knox City and
Seymour mesonet stations.
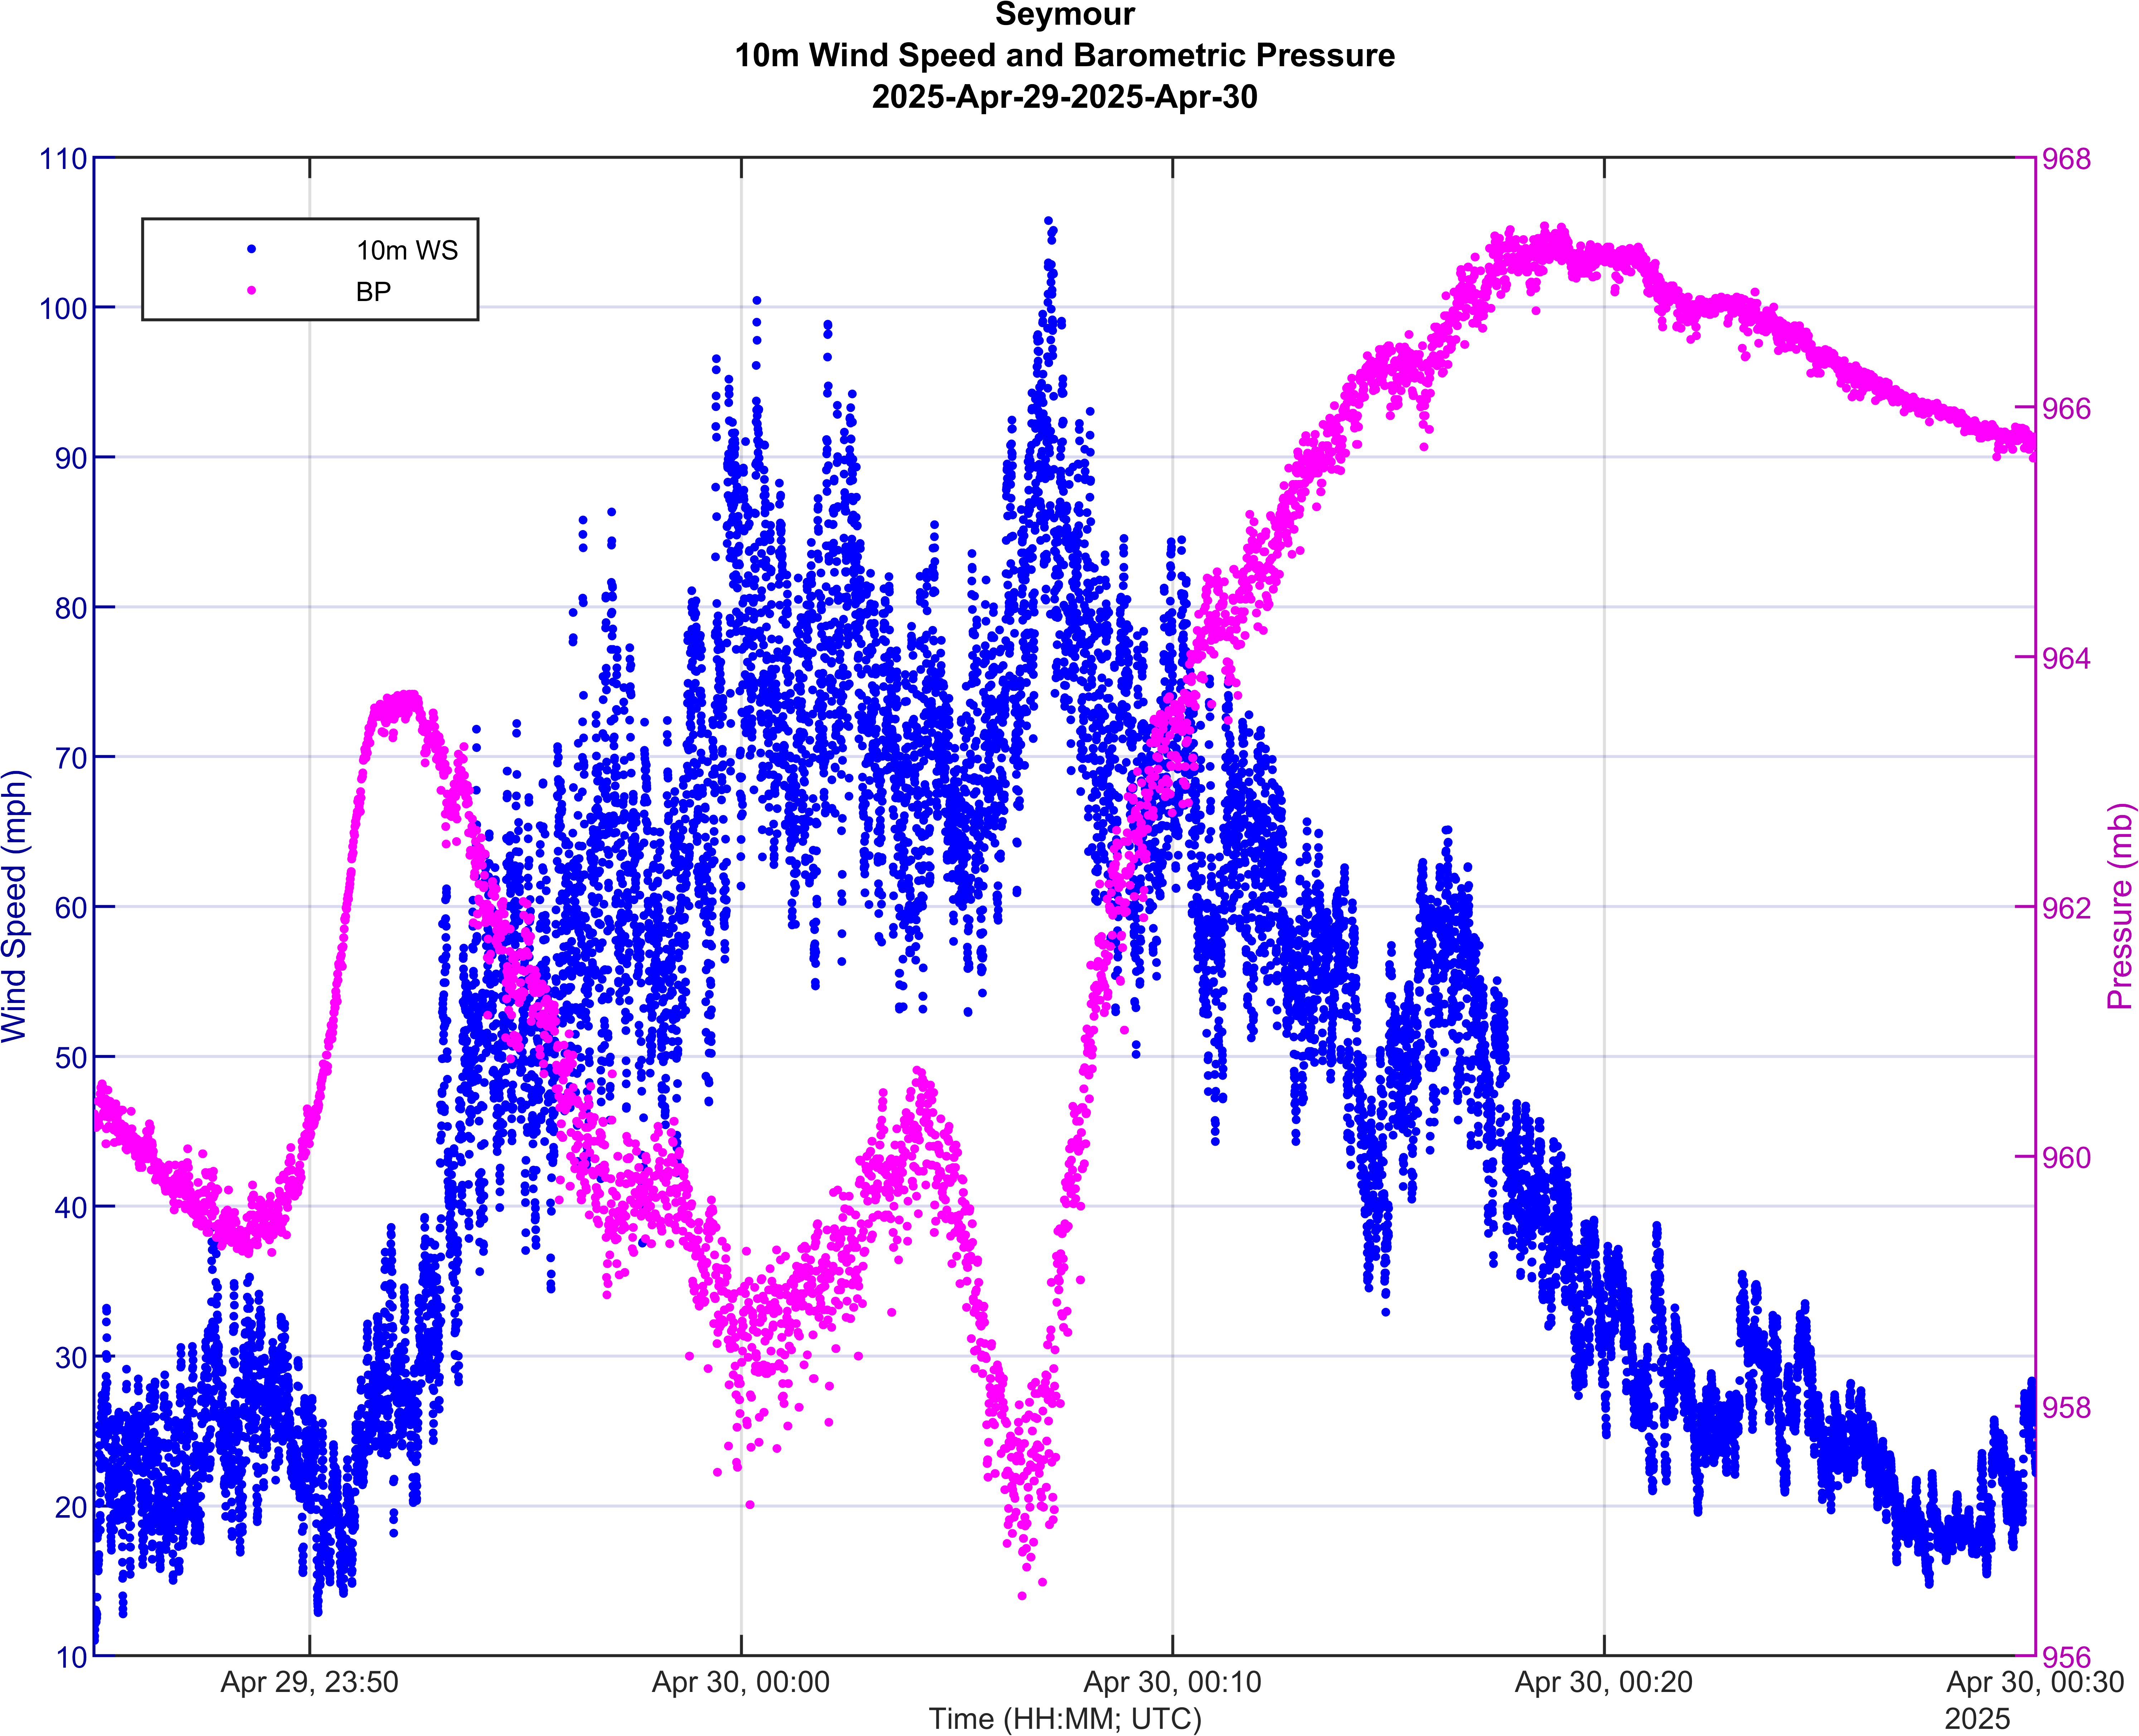 Figure 6: Wind speed and barometric pressure time histories from the Seymour mesonet
station.
Figure 6: Wind speed and barometric pressure time histories from the Seymour mesonet
station.
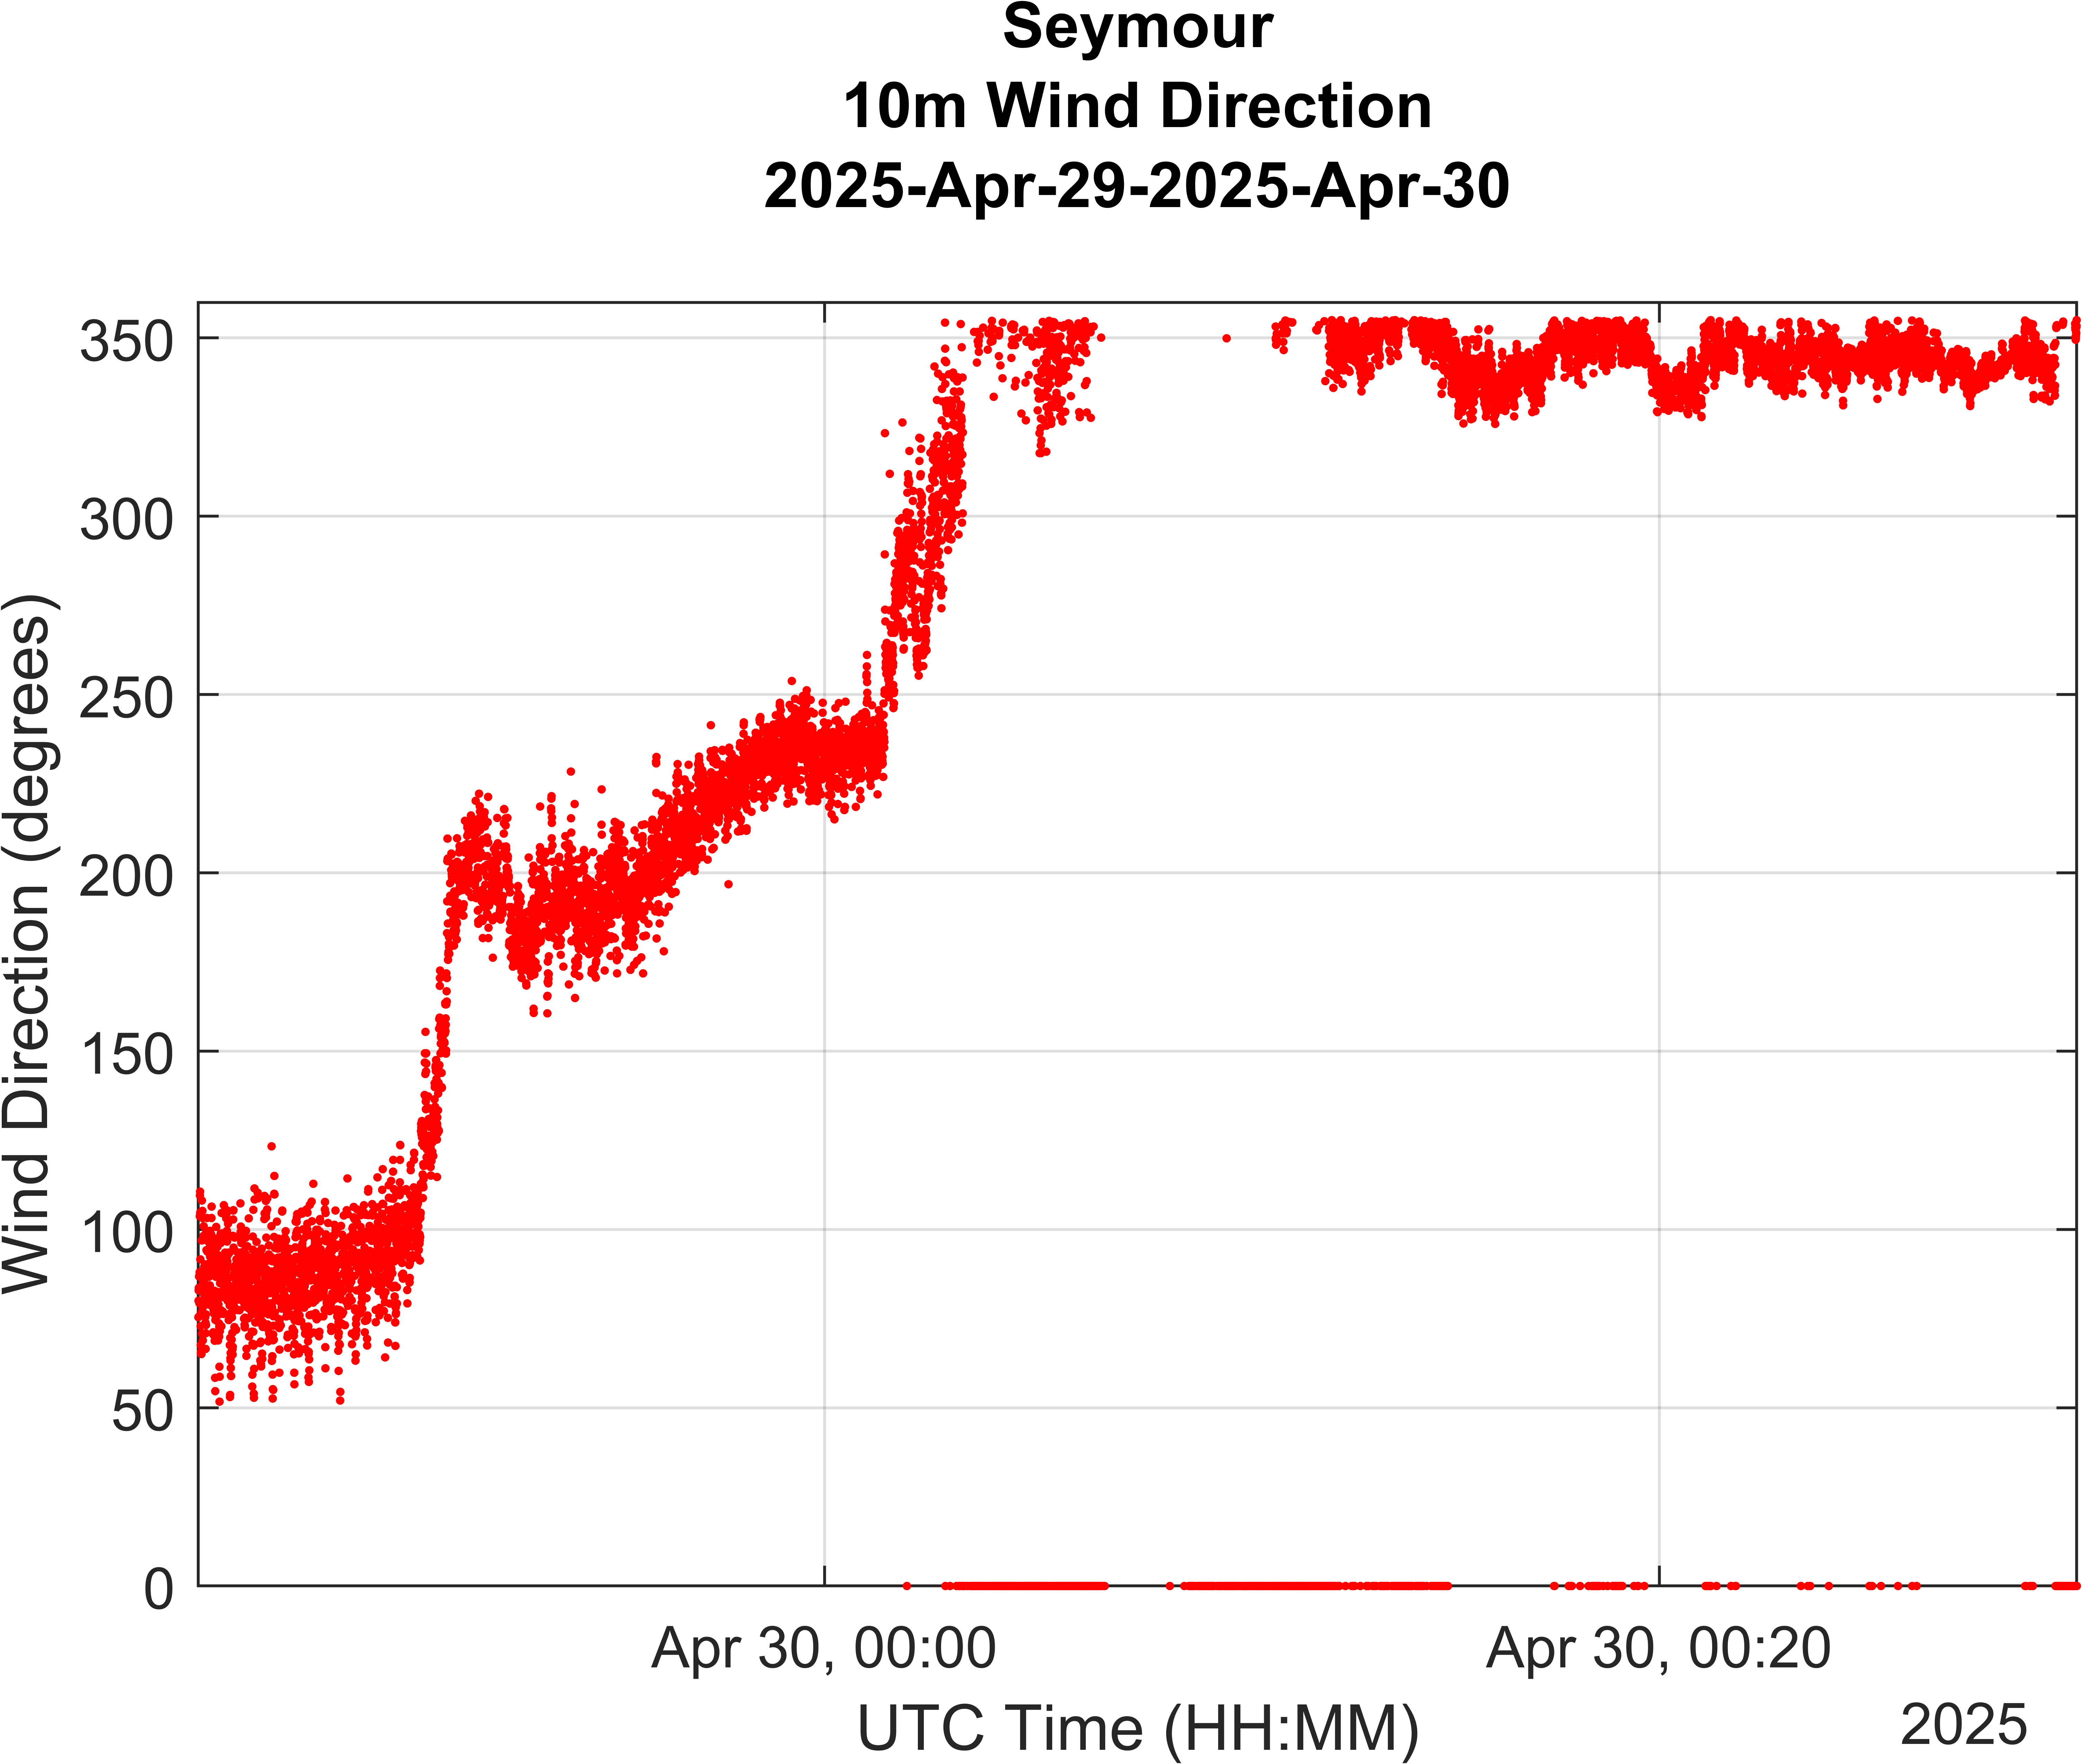 Figure 7: Wind direction time history from the Seymour mesonet station.
This event highlights the value of high-frequency 5-Hz data. If only standard 1-minute observations had been available, many of the small-scale variations that helped characterize this storm would have been missed. These high-resolution data points are invaluable for data quality assessments, allowing researchers to confirm the validity of extreme measurements. Furthermore, identifying these small-scale features can aid in understanding the specific weather phenomena that caused the extreme readings—information that is vital for agencies like the National Weather Service when accessing damage reports and for warning verification.
National Wind Institute
-
Address
1009 Canton Ave., MS 3155 Lubbock, TX 79409-3155 -
Phone
National Wind Institute - 806.742.3476; Renewable Energy - 806.742.6284 -
Email
National Wind Institute - nwi@ttu.edu; Renewable Energy - windenergy@ttu.edu