
HPCC Usage Metrics (XDMoD)
What is HPCC XDMoD?
HPCC XDMoD (XD Metrics on Demand) is the High Performance Computing Center’s usage portal for the RedRaider cluster. It turns the cluster’s job records into charts: how many CPU and GPU hours you used, how long your jobs waited in the queue, how large and how long they were, and, for PIs, the same for the whole research group.
It is read-only and does not change anything on the cluster. Use it to plan your work, choose partitions, right-size job requests, and report your group’s computing for grants and annual reports.
Getting to the portal
- Open https://xdmod.hpcc.ttu.edu in a web browser, or go to the menu, click Resource & Status, and then select Usage Metrics (XDMoD) under the RedRaider Cluster.
- You can access the portal on the TTU campus network or through the TTU VPN.
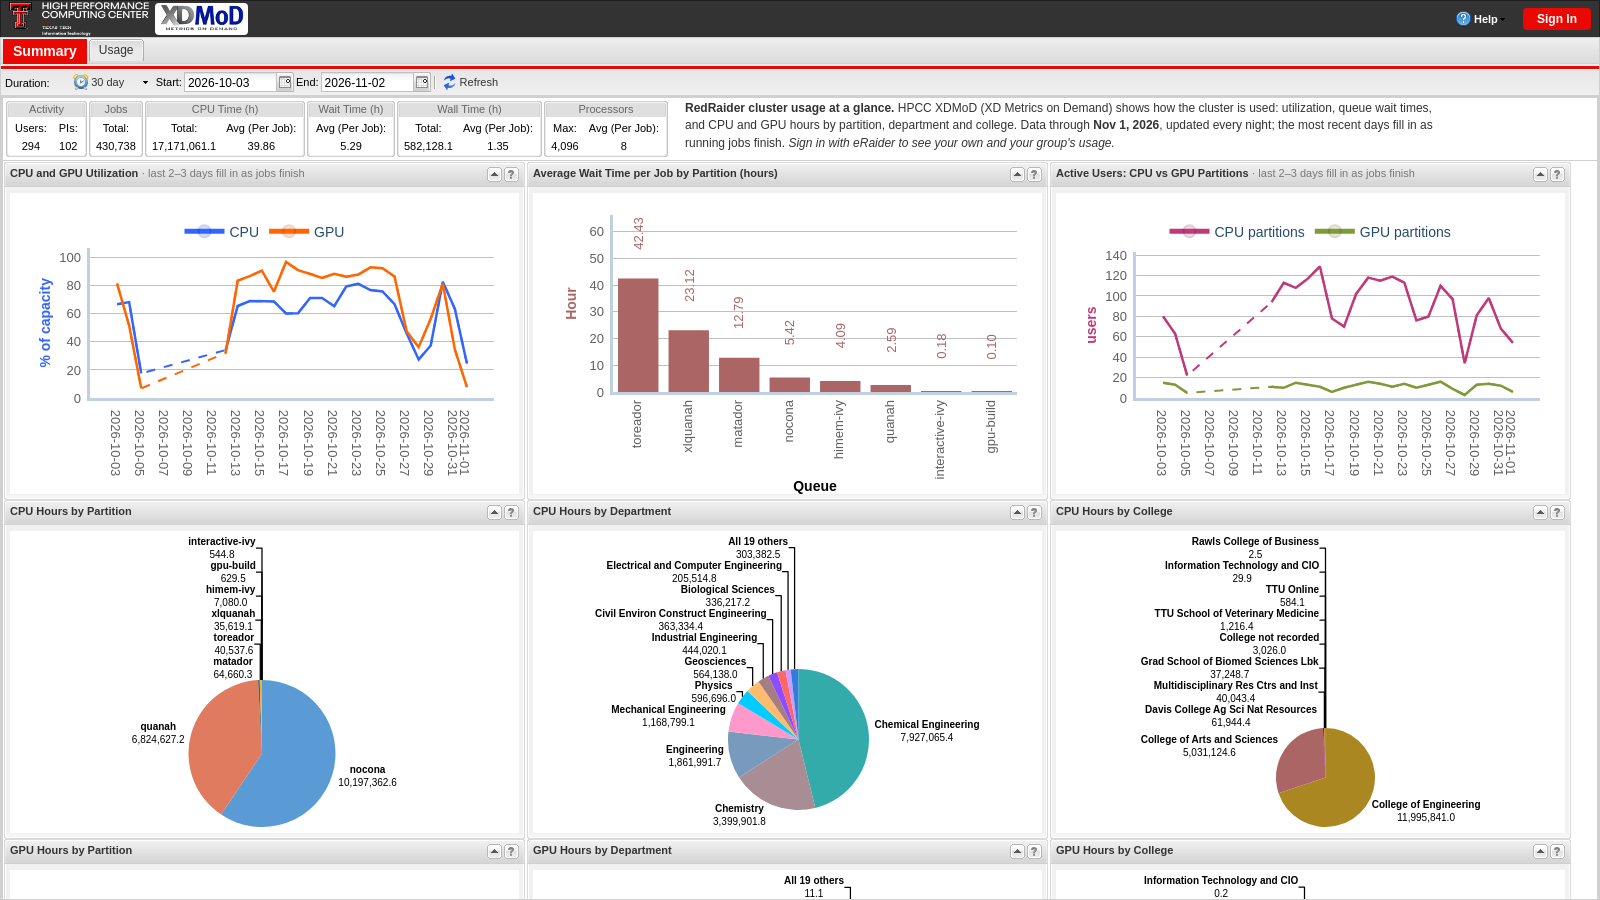
- Without signing in, you see the public summary of the whole cluster.
- To see your own usage, click Sign In (top right) and then sign in with eRaider. You need an active HPCC account.
- Your name and e-mail come from your HPCC account and cannot be changed in the portal. To update them, contact hpccsupport@ttu.edu.
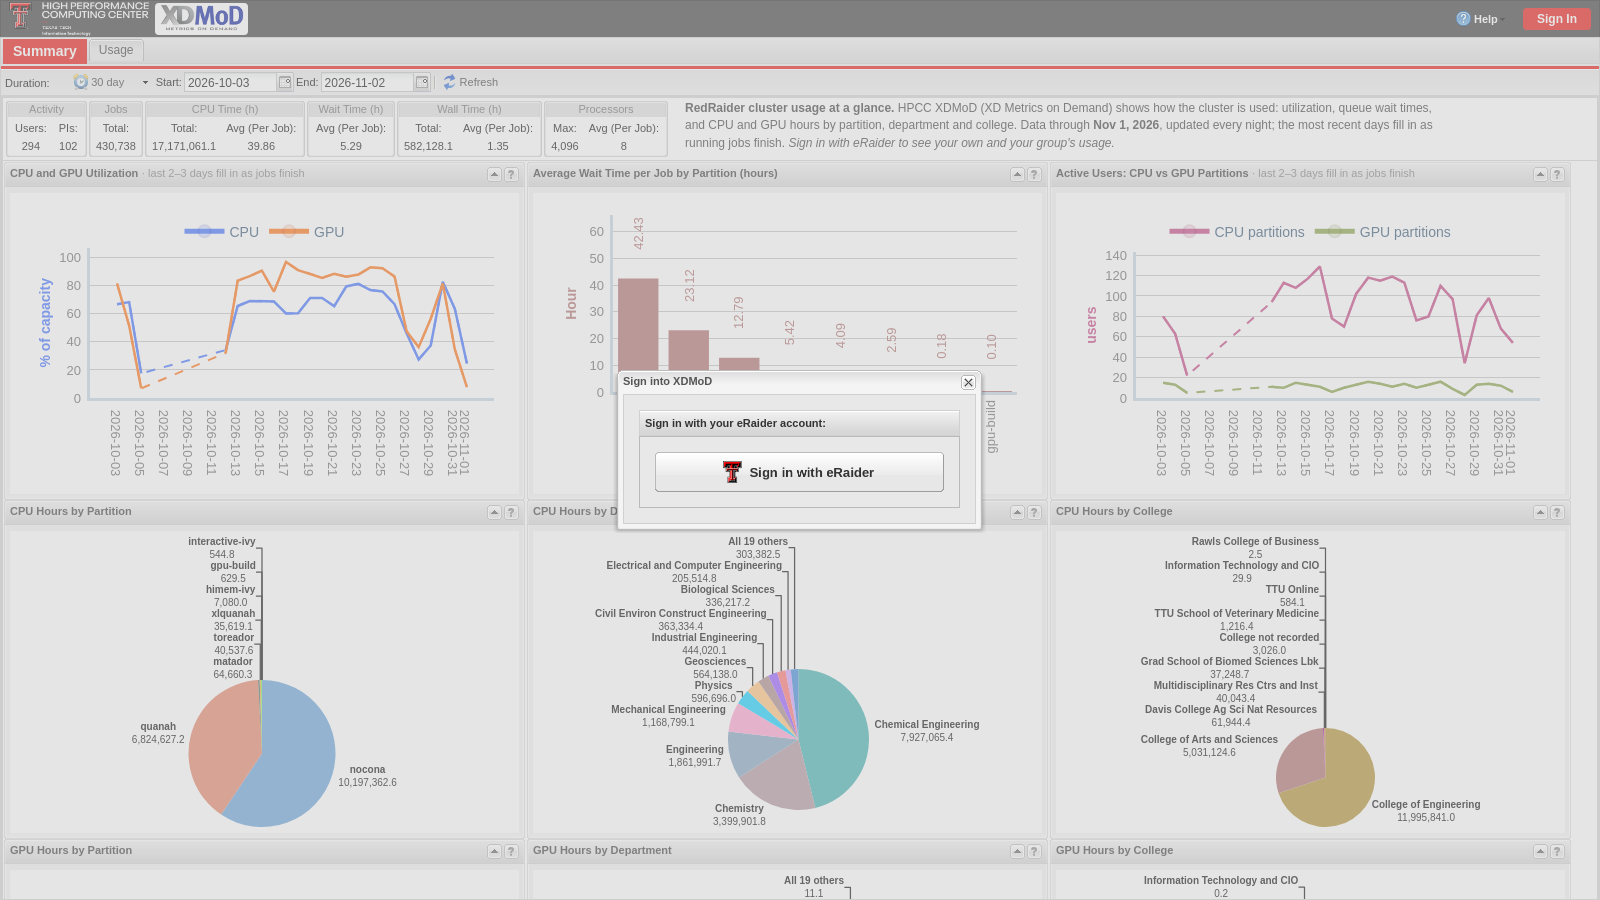
The Summary page
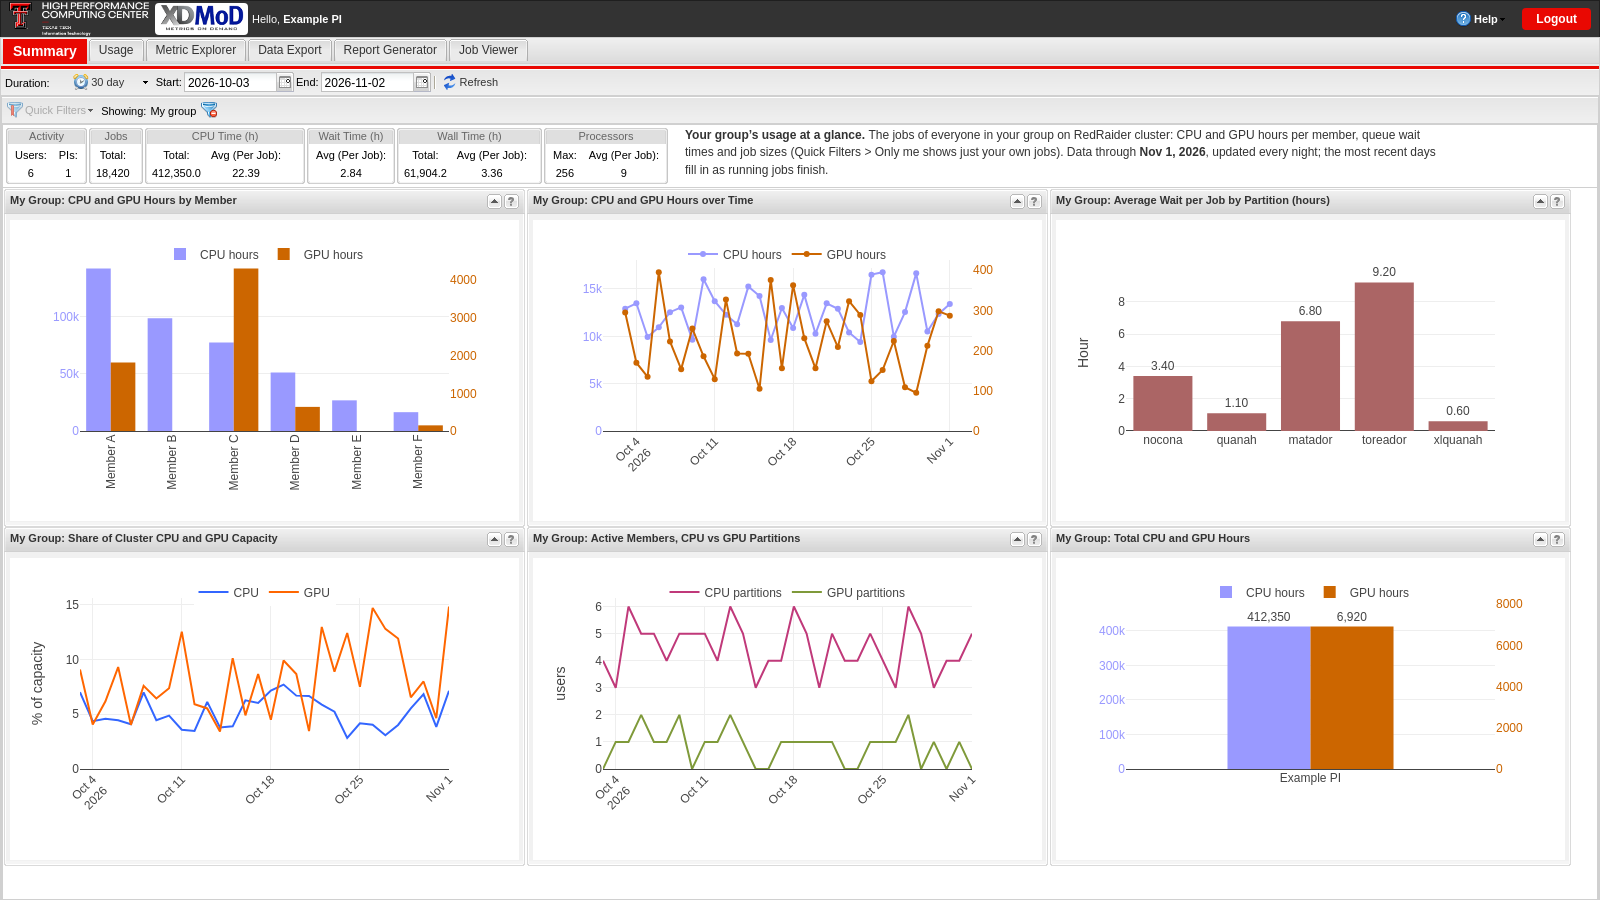
After you sign in, the Summary page shows the most useful charts at a glance.
The tabs along the top of the page:
| Tab | What it is for |
|---|---|
| Summary | Your most useful charts at a glance (this page). |
| Usage | A library of ready-made charts with many more measures and breakdowns; most can be exported as an image or as data (CSV). |
| Metric Explorer | Build, combine and save your own charts. |
| Data Export | Request your job records as a CSV or JSON file; you get an e-mail when it is ready (kept for 30 days). |
| Report Generator | Put charts together into a PDF report and have it e-mailed to you on a schedule, e.g. a monthly group report. |
| Job Viewer | Look up individual jobs (PIs: also their group’s jobs) with their dates, partition, size, wait and run time. |
- Summary boxes at the top: number of jobs, CPU hours, average wait and run time, and job sizes.
- Duration: the charts cover the last 30 days by default. Pick another period from the menu or set your own start and end dates.
- Data freshness: data is updated every night. A job appears after it ends, so the newest two or three days fill in over time (the charts say so in their title).
- Reading charts: hover over a bar or point to see its exact value; click a legend entry to hide or show that series; the ? icon on each chart explains it.
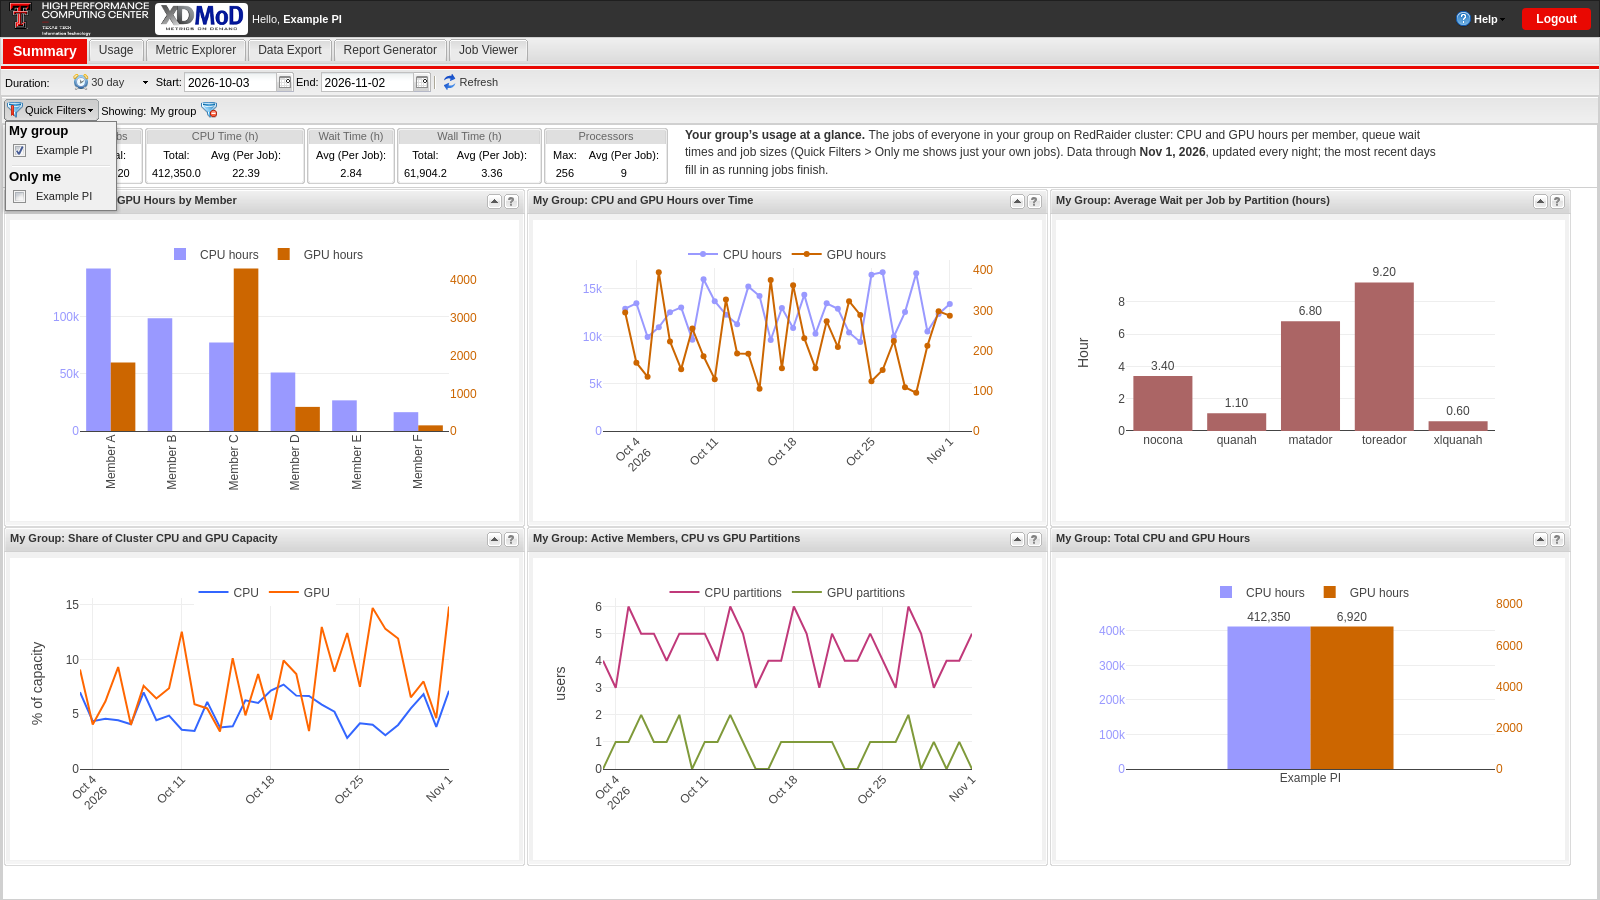
Your view: Only me, My group, or the whole cluster
What the charts show depends on the Quick Filters bar below the Duration, and the chart titles always tell you which view you are in:
| Quick Filter | Chart titles start with | The charts show |
|---|---|---|
| Only me | My … | Your own jobs (the default for users) |
| My group (PIs) | My Group: … | The jobs of everyone in your group (the default for PIs) |
| None (filter removed) | Cluster: … | The whole RedRaider cluster, for comparison |
Only one Quick Filter can be on at a time. Remove it with the × next to it to compare with the whole cluster.
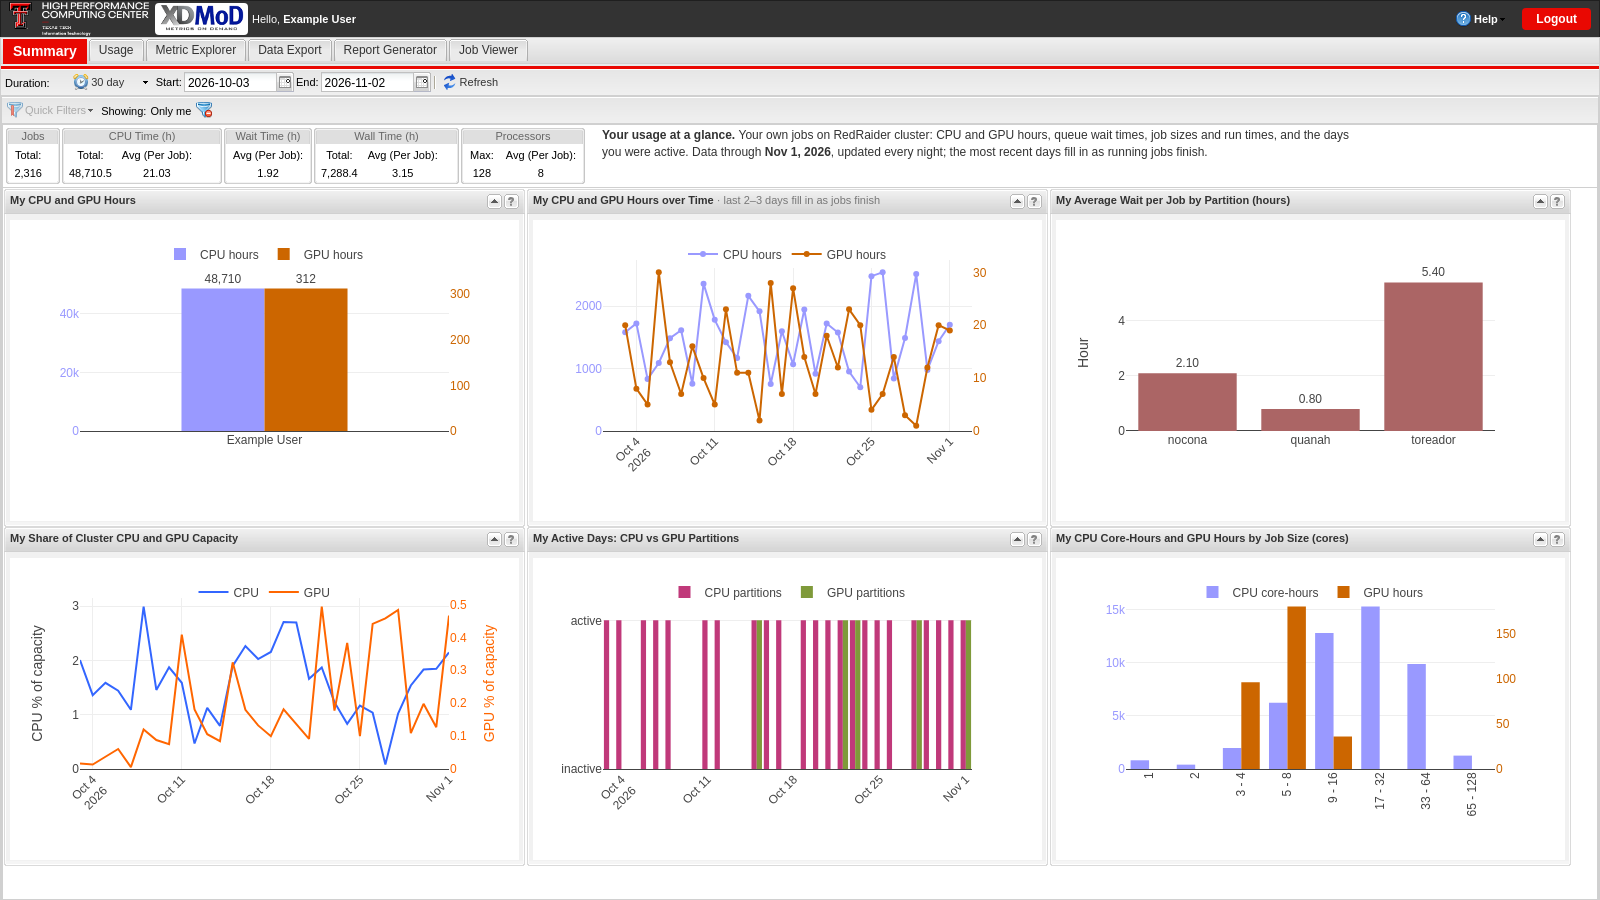
For users
Your Summary shows only your own jobs. A few things to look for:
- My CPU and GPU Hours and My CPU and GPU Hours over Time: how much you computed and when.
- Average Wait per Job by Partition, Jobs by Wait Time and Average Wait Time over Time: where and when your jobs start fastest. If one partition keeps you waiting, another one may fit.
- Jobs by Wall Time and Job Size: how long and how wide your jobs really are. Asking for a wall time close to what jobs actually need, and for the cores they really use, usually gets them started sooner.
- My Active Days: the days you ran jobs on CPU and GPU partitions.
For sponsors and PIs
As a PI, you see your whole group by default (“My Group”). Useful charts:
- CPU and GPU Hours by Member and Jobs Completed by Member: who in the group uses the cluster, and how much.
- For large groups, these charts show the 10 most active members. To see everyone, open the same chart in the Usage tab and turn on Show Remainder, or page through the list in Metric Explorer.
- Total CPU and GPU Hours: the group’s totals for the selected period. Set the Duration to a year or a grant period for annual reports and proposals.
- Job Size and the wait-time charts: whether your group’s jobs fit the partitions they use and how long members wait.
- Switch the Quick Filter to Only me to see just your own jobs.
Good to know
- The portal covers RedRaider jobs since January 2021.
- CPU hours are core-hours (cores × hours); GPU hours are GPU-hours (GPUs × hours).
- Names are shown as first initial and last name (for example, “M. Smith”); the cluster view shows usernames instead.
- Your access follows your HPCC account: if the account is no longer active, the portal sign-in stops working too.
Help
- More details: XDMoD User Manual.
- Questions, problems, or ideas for the portal: e-mail hpccsupport@ttu.edu.
High Performance Computing Center
-
Phone
806.742.4350 -
Email
hpccsupport@ttu.edu