
Section 3-2: Linear Functions (pages 97-106)
-
Demo Course

- TTU K-12 Demo Courses
Section 3-2: Linear Functions (pages 97-106)
Understanding Mathematical Terms
Refer to the English-Spanish Glossary, which starts on textbook page A39, if you need help with a definition or finding a textbook page with an example for a vocabulary word.
Explorations
As you read and work through Explorations 1 and Communicate Your Answer on page 97, you will learn to identify linear and nonlinear patterns. If two figures are similar, then the ratio of their perimeters is equal to the ratio of their corresponding side lengths. This will be a linear relationship. If two figures are similar, then the ratio of their areas is equal to the square of the ratio of their corresponding side lengths. This will be a nonlinear relationship.
You can also use your graphing calculator for this exploration. You can graph the equation and look at the associated table of values. For discrete data, enter ordered pairs in the STAT mode of the calculator and graph the associated scatter plot. After finishing Explorations 1 and Communicate Your Answer, check your answers below.
Answers to Explorations and Communicate Your Answer
Exploration 1 (page 97)
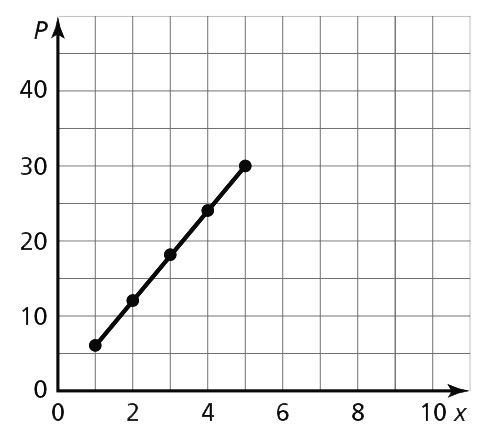
- 6, 12, 18, 24, 30;
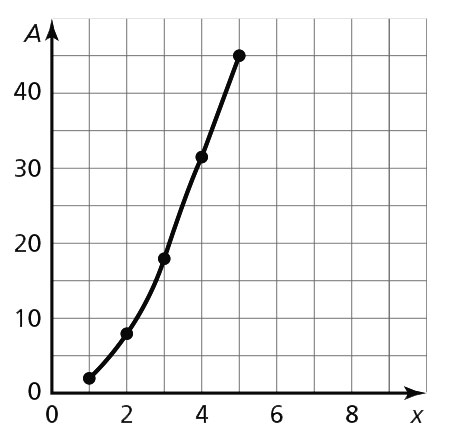
- 2, 8, 18, 32, 50;
- 2
 or about 6.3, 4 or about 12.6, 6 or about 18.8, 8 or about 25.1, 10 or about 31.4;
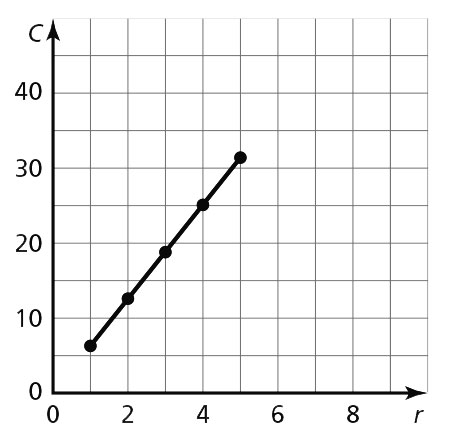
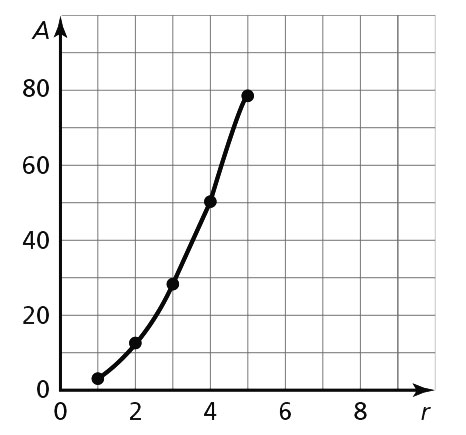
- or about 3.1, 4 or about 12.6, 9 or about 28.3, 16 or about 50.3, 25 or about 78.5;
Communicate Your Answer (page 97)
- No vertical line can be drawn through more than one point on any of the graphs.
- Sketch the graph of the function. When the graph is a line, the pattern is linear. When the graph is not a line, the pattern is not linear.
- Sample answer: Distance traveled during a time interval at constant speed is linear. Distance traveled during a time interval while accelerating is nonlinear.
Section 3-2 Lesson (pages 99-102)
Study and work through Examples 1 through 5. It is very important that you go back to what you have learned before you started Algebra 1. You studied identifying linear functions. This section should be a review. Practice with the Monitoring Progress problems as you go, and then check your answers below.
Answers to Monitoring Progress (pages 91-93)
- linear; The graph is a line.
- nonlinear; The graph is not a line.
- linear; As x increases by 1, y increases by 2. The rate of change is constant.
- nonlinear; As x increases by 1, y decreases by different amounts. The rate of change is not constant.
- linear; It can be written in the form y = 1x + 9.
- linear; It can be written in the form y =
 + 0
+ 0 - nonlinear; It cannot be written in the form y = mx + b
- a. 0, 1, 2, 3, 4, 5; discrete; Sample answer: The number of DVDs bought must be a whole number and m must be at least 0.
b.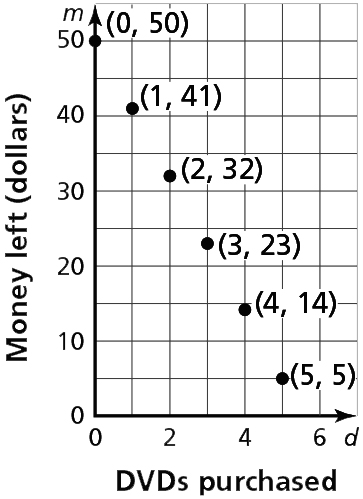
c. 5, 14, 23, 32, 41, 50 - discrete; the number of stories must be a whole number.
- a. yes; As m increases by 1, g decreases by 2.5. The rate of change is constant.
b. 0 ≤ m ≤ 8; continuous; A tub can drain for part of a minute, so the time can be any value between 0 and 8.
c.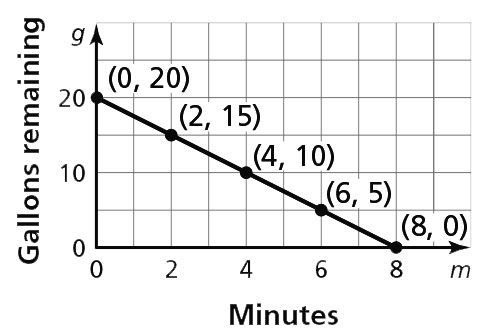
d. 0 ≤ g ≤ 20 - Sample answer: A teacher gives every student 2 bonus points on a 6-point quiz. x is the original score and y is the recorded score; discrete; The original score must be a whole number.
- Sample answer: A marble starts rolling 2 centimeters from a wall and rolls at a constant speed of 0.5 centimeters per second for 6 seconds; continuous; The rolling time can be any value between 0 and 6.
Texas Tech K-12
-
Address
Texas Tech Plaza | 1901 University Ave, Lubbock, TX 79401 -
Phone
(800) 692-6877 -
Email
ttuk12@ttu.edu