
Section 3-4: Graphing Linear Equations in Standard Form (pages 115-122)
-
Demo Course

- TTU K-12 Demo Courses
Section 3-4: Graphing Linear Equations in Standard Form (pages 115-122)
Understanding Mathematical Terms
Refer to the English-Spanish Glossary, which starts on textbook page A39, if you need help with a definition or finding a textbook page with an example for a vocabulary word.
Explorations
Read and work through Explorations 1 and 2 and Communicate Your Answer on page 115, which use verbal models written in standard form. Symbolic manipulation is involved when writing linear equations in standard form, slope-intercept form, and point-slope form. You will have a chance to practice this later.
The skill of solving an equation for y becomes clear when using a graphing calculator because equations must be in function form to enter them in most calculators. Then, check your answers below.
Answers to Explorations and Communicate Your Answer
Exploration 1 (page 115)
- 4x + 2y = 16
- 0, 1, 2, 3, 4; 8, 6, 4, 2, 0
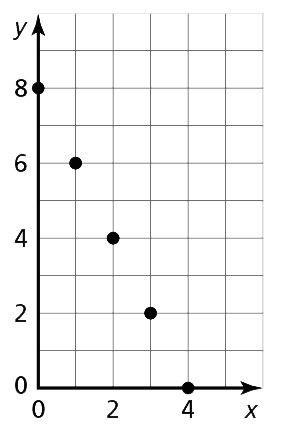
The points create a line with a slope of –2. For each adult ticket sold, the number of child tickets sold decreases by 2. - yes; The relationship can be expressed as an equation with 2 variables. If the value of one of the variables is known, the other can be found.
Exploration 2 (page 115)
- 8x + 6y = 48
- y = 8 –

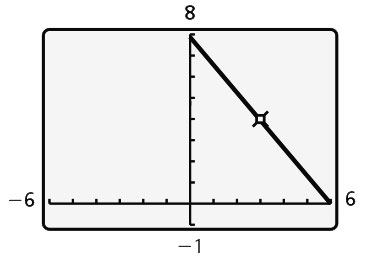
domain: 0 ≤ x ≤ 6; range: 0 ≤ x ≤ 8 - x-intercept: 6; y-intercept: 8
- To find the x-intercept, set y = 0 and solve for x, to find the y-intercept, set x = 0 and solve for y; Because the intercepts are where the graph crosses the axes, the y-coordinate of the x-intercept must be 0, and the x-coordinate of the y-intercept must be 0.
- The intercepts represent the maximum number of pounds of each type of cheese you can buy if you only buy one type of cheese.
Communicate Your Answer (page 115)
- a straight line
- Sample answer: You sold a total of $375 worth of DVDs. You forgot to record how many of each type you sold. TV season DVDs sold for $30 each and movie DVDs sold for $15 each.
Section 3-4 Lesson (pages 116-119)
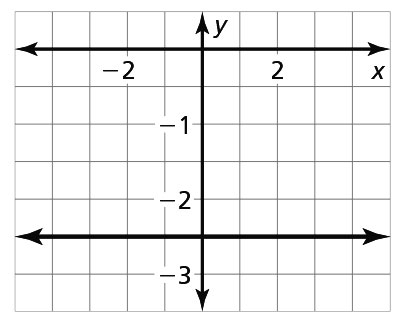
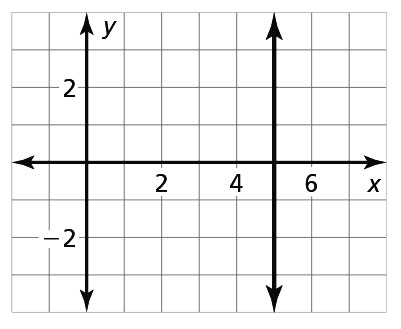
Study and work through Examples 1 through 5. You will graph vertical and horizontal lines, and learn about intercepts and zeros of functions. Practice with the Monitoring Progress problems as you go, and then check your answers below.
Answers to Monitoring Progress (pages 116-119)
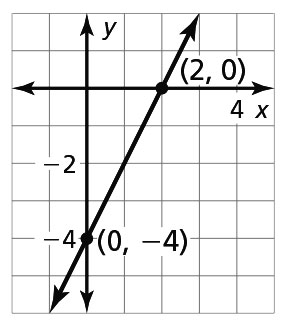
- 4
- -4
- 10

- 12.5; The tub is empty after 12.5 seconds.
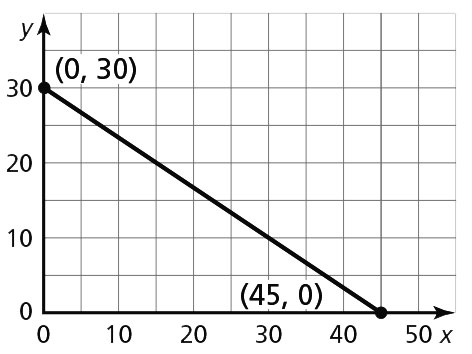
The x-intercept shows that you can rent 45 small tables and 0 large tables. The y-intercept shows that you can rent 30 large tables and 0 small tables.
Texas Tech K-12
-
Address
Texas Tech Plaza | 1901 University Ave, Lubbock, TX 79401 -
Phone
(800) 692-6877 -
Email
ttuk12@ttu.edu