
Section 3-7: Transformations of Graphs of Linear Functions (pages 139-148)
-
Demo Course

- TTU K-12 Demo Courses
Section 3-7: Transformations of Graphs of Linear Functions (pages 139-148)
Understanding Mathematical Terms
Refer to the English-Spanish Glossary, which starts on textbook page A39, if you need help with a definition or finding a textbook page with an example for a vocabulary word.
Explorations
Read and work through the Explorations 1 and 2 and Communicate Your Answer on page 139. Then, check your answers below.
Answers to Explorations and Communicate Your Answer
Exploration 1 (page 139)
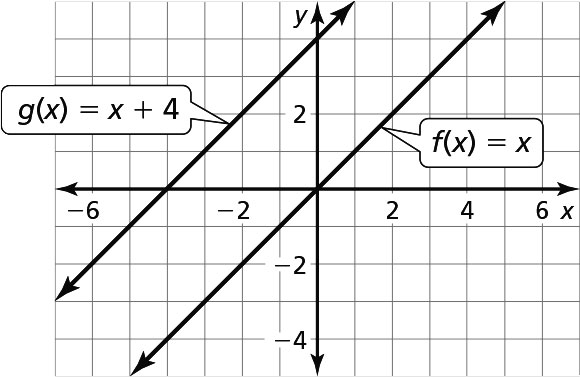
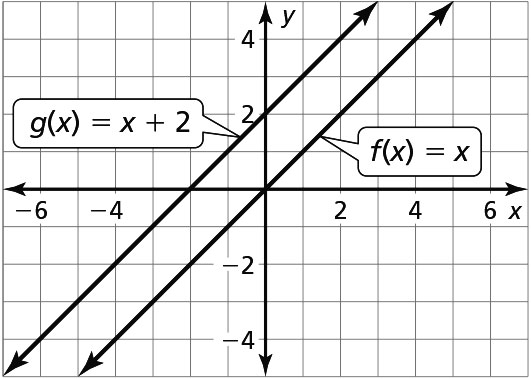
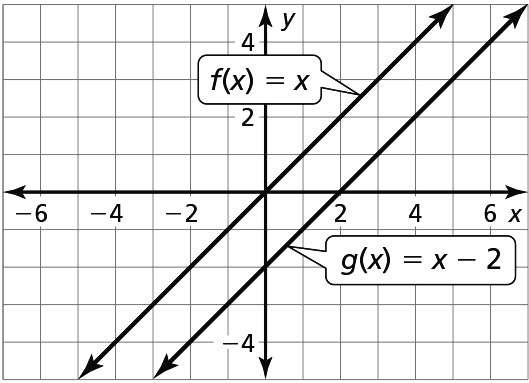
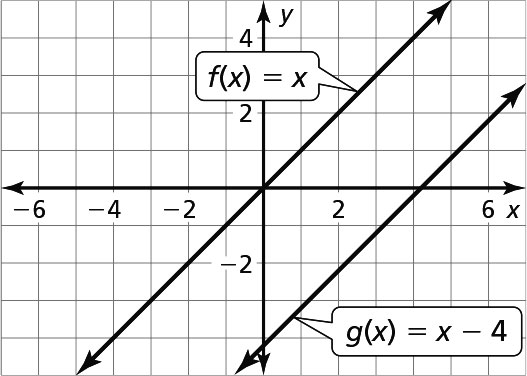
Adding or subtracting a constant to a function causes a vertical shift to the graph.
Exploration 2 (page 139)
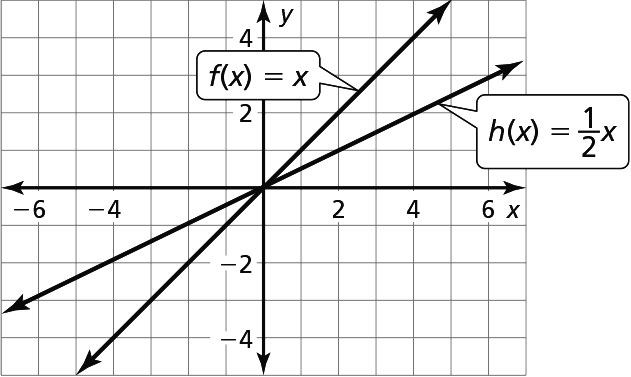
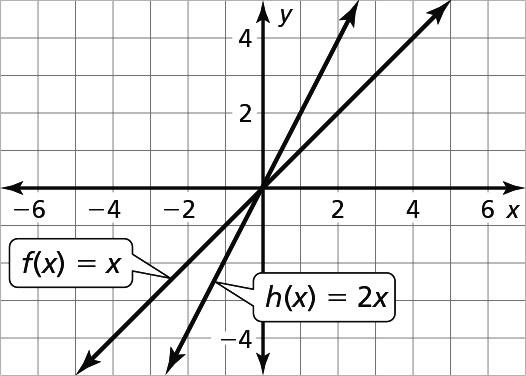
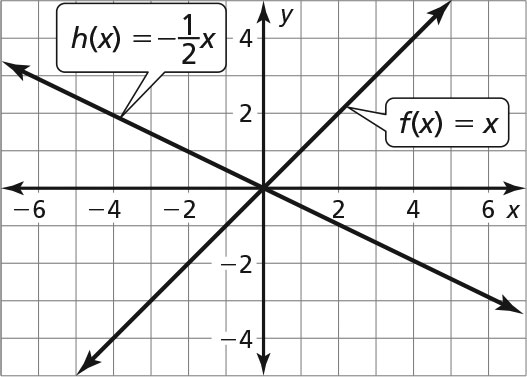
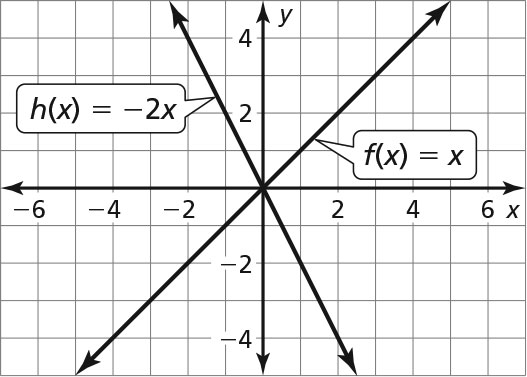
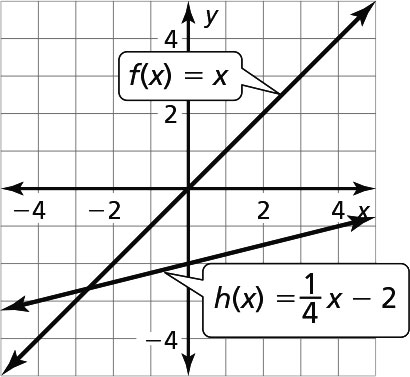
The graph of h(x) = cx has a steeper slope than the graph of f(x) = x when c < –1 or c > 1, is not as steep as the graph of f(x) = x when –1 < c < 1, and slopes downward from left to right when c is negative.
Exploration 3 (page 139)
- C; The graph is shifted down 4 units and has a steeper slope.
- A; The graph is shifted up 2 units, has a steeper slope, and slopes downward from left to right.
- D; The graph is shifted up 4 units and is not as steep.
- B; The graph is shifted down 2 units, is not as steep, and slopes downward from left to right.
Communicate Your Answer (page 139)
- The graph of g(x) = f(x) + c is shifted vertically from f(x) = x. The graph of h(x) = f(cx) has a different slope from f(x) = x.
Section 3-7 Lesson (pages 140-144)
Study and work through Examples 1 through 6. Read them carefully. There is a lot of information in this lesson. Visualize transformations before you do them. Terminology is very important. Use your graphing calculator to graph the parent function and then the transformation. Practice with the Monitoring Progress problems as you go, and then check your answers below.
Answers to Monitoring Progress (pages 141, 143-144)
-
a.
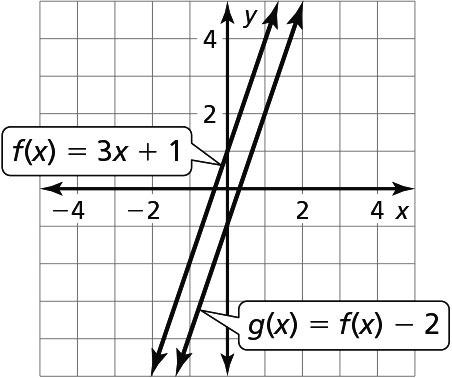
The graph of g is a vertical translation 2 units down of the graph of f.
b.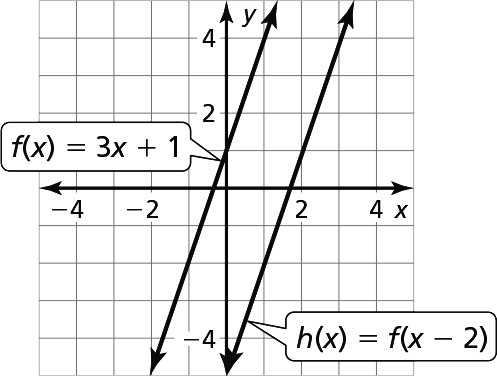
The graph of t is a horizontal translation 2 units right of the graph of f. -
a.
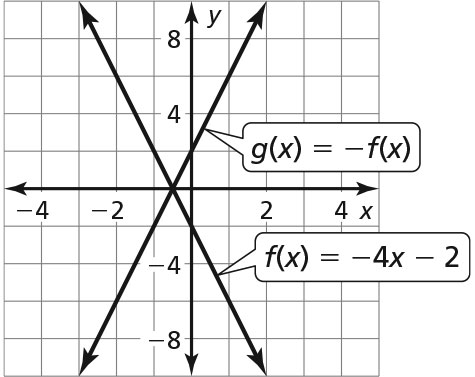
The graph of g is a reflection in the x-axis of the graph of f.
b.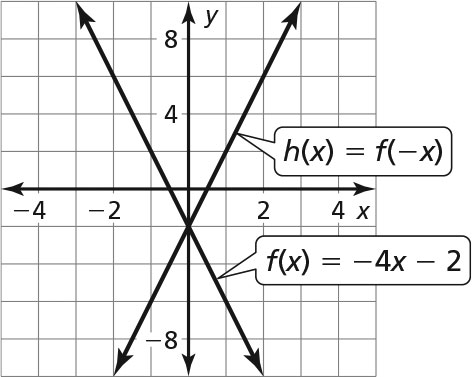
The graph of h is a reflection in the y-axis of the graph of f. -
a.
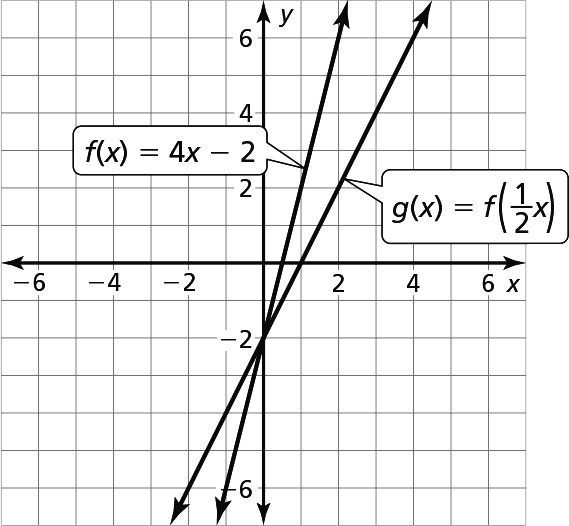
The graph of g is a horizontal stretch of the graph of f by a factor of 2.
b.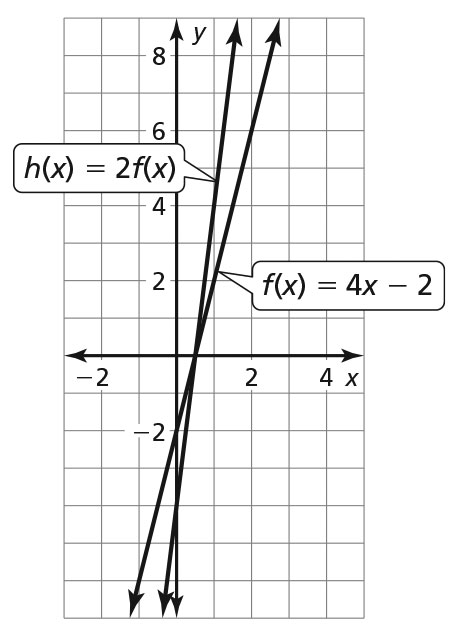
The graph of h is a vertical stretch of the graph of f by a factor of 2. -
a.
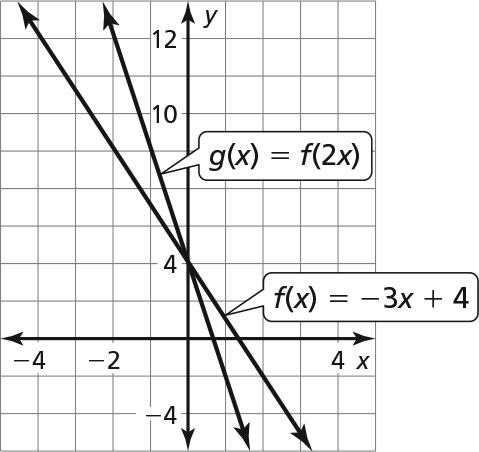
The graph of g is a horizontal shrink of the graph of f by a factor of
b.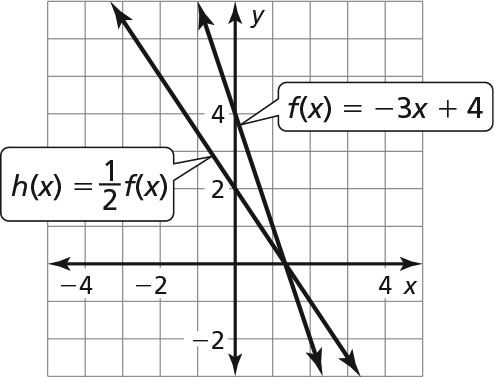
The graph of h is a vertical shrink of the graph of f by a factor of -
The transformations are a vertical shrink by a factor of and then a vertical translation 2 units down.
Texas Tech K-12
-
Address
Texas Tech Plaza | 1901 University Ave, Lubbock, TX 79401 -
Phone
(800) 692-6877 -
Email
ttuk12@ttu.edu