Section 5-6: Linear Inequalities in Two Variables (pages 251-258)
Section 5-6: Linear Inequalities in Two Variables (pages 251-258)
Understanding Mathematical Terms
Refer to the English-Spanish Glossary, which starts on textbook page A39, if you need help with a definition or finding a textbook page with an example for a vocabulary word.
Explorations
Read and work through the Explorations 1 through 3 on page 251. You will use what you know about inequalities. Then, check your answers below.
Answers to Explorations and Communicate Your Answer
Exploration 1 (page 251)
- y = x – 3
- all ordered pairs below the graph of y = x – 3
- y < x – 3; <; Sample answer: The point (4, 0) is in the shaded region, and to make the inequality true for that point the < symbol is needed.
Exploration 2 (page 251)
- 0 ≥ –3
Exploration 3 (page 251)
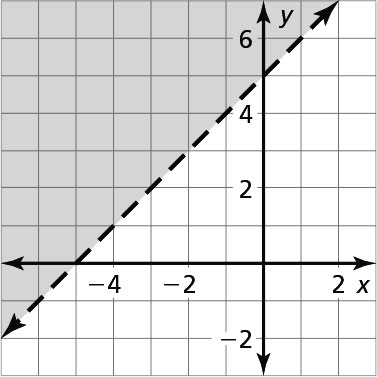
Sample answer: Graph y = x + 5 with a dashed line. Test the point (0, 0), which does not make the inequality true. Shade the half-plane that does not contain the point (0, 0).
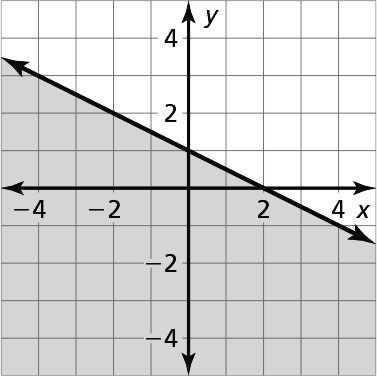
Sample answer: Graph y =
 + 1 with a solid line. Test the point (0, 0), which does make the inequality true. Shade the half-plane that contains the point (0, 0).
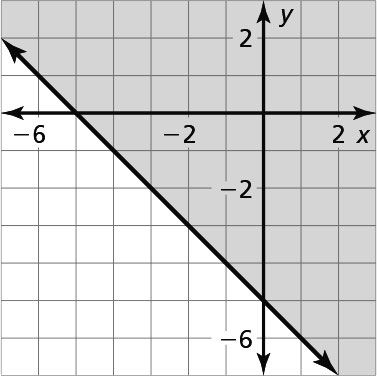
Sample answer: Graph y = –x – 5 with a solid line. Test the point (0, 0), which does make the inequality true. Shade the half-plane that contains the point (0, 0).
Section 5-6 Lesson (pages 252-255)
This lesson presents how to graph a linear inequality in the coordinate plane so that in the next lesson you can graph systems of linear inequalities. You have graphed inequalities on a number line. Relate the solid and dashed lines in the coordinate plane to the closed and open circles used when inequalities in one variable are graphed on a number line. The closed and open circles are boundaries, creating two half-lines. The solid and dashed lines are boundaries, creating two half-planes.
Study and read Examples 1 through 6 carefully. You will want to use your graphing calculator. Practice with the Monitoring Progress problems as you go, and then check your answers below.
Answers to Monitoring Progress (pages 252-255)
- No
- No
- Yes
- Yes
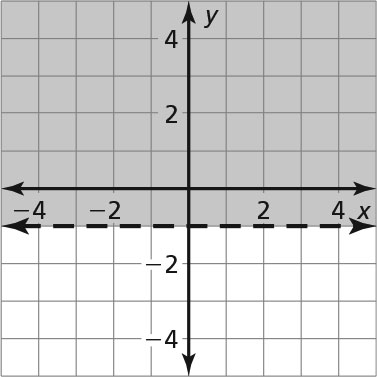
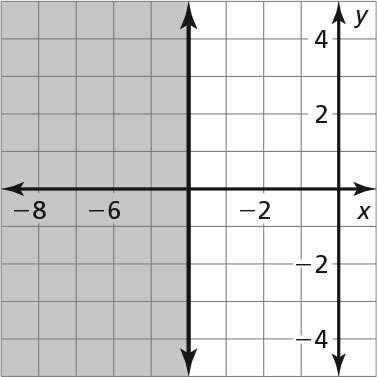
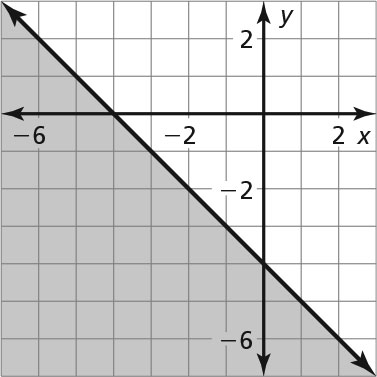
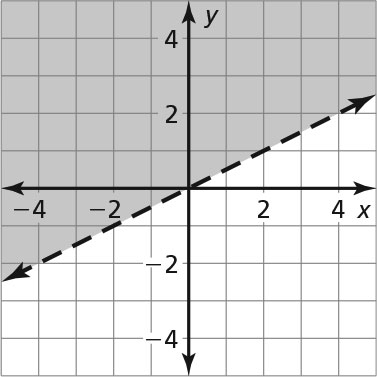
-
y > x + 3
-
x + y > 19
-
y ≤
 + 4
+ 4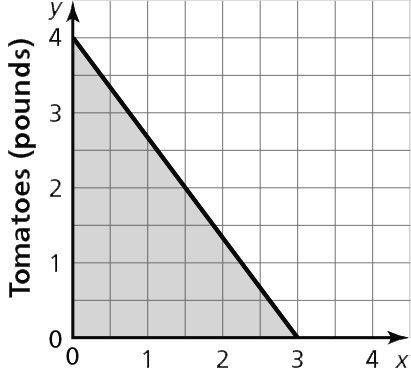
Sample answer: (3, 0), You can buy 3 pounds of red peppers and no tomatoes; (1, 1), You can buy 1 pound of red peppers and 1 pound of tomatoes.
Texas Tech K-12
-
Address
Texas Tech Plaza | 1901 University Ave, Lubbock, TX 79401 -
Phone
(800) 692-6877 -
Email
ttuk12@ttu.edu

