
Section 3-5: Graphing Linear Equations in Slope-Intercept Form (pages 123-132)
-
Demo Course

- TTU K-12 Demo Courses
Section 3-5: Graphing Linear Equations in Slope-Intercept Form (pages 123-132)
Understanding Mathematical Terms
Refer to the English-Spanish Glossary, which starts on textbook page A39, if you need help with a definition or finding a textbook page with an example for a vocabulary word.
Explorations
In a previous math course, you learned about slope of a line. You will revisit it in this lesson. Graphing a line given the slope and y-intercept is easy because you have all the information given to you in the equation. Read and work through the Explorations 1 and 2 and Communicate Your Answer on page 123. Then, check your answers below.
Answers to Explorations and Communicate Your Answer
Exploration 1 (page 123)
 ; 2
; 2- -2; -1
Exploration 2 (page 123)
line; ; 3
; 3
line; 2; –2
line; –1; 1
line; 1; –4
In the graph of y = mx + b, m is the slope of the line and b is the y-intercept of the line.
Communicate Your Answer (page 123)
- a line with slope m and y-intercept b
a. The value of m affects the steepness of the graph and whether the graph rises or falls from left to right.
b. The value of b affects the location of the y-intercept.
c. (1) Sample answer:
y = x – 2; slope: 1; y-intercept: –2
(2) Sample answer:
y = 2x – 1; slope: 2; y-intercept: –1
Section 3-5 Lesson (pages 124-128)
Study and work through Examples 1 through 6. Read them carefully. They are very easy to follow. Practice with the Monitoring Progress problems as you go, and then check your answers below.
Answers to Monitoring Progress (pages 124-128)
-
negative;

-
positive;
-
positive;

-
Choose any 2 points from the table and use the slope formula;

-
Choose any 2 points from the table and use the slope formula; undefined
-
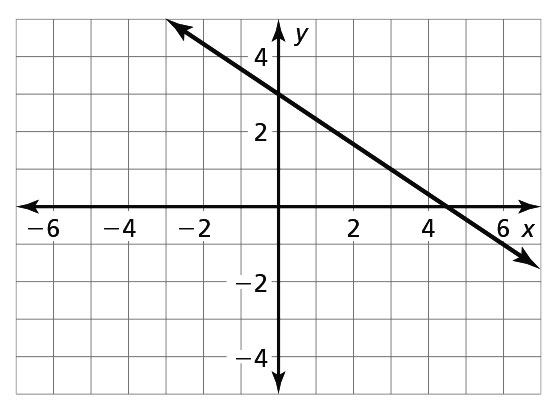
slope: –6; y-intercept: 1
-
slope: 0; y-intercept: 8
-
slope:
 ; y-intercept:
-
x-intercept: 1 -
x-intercept: –1 -
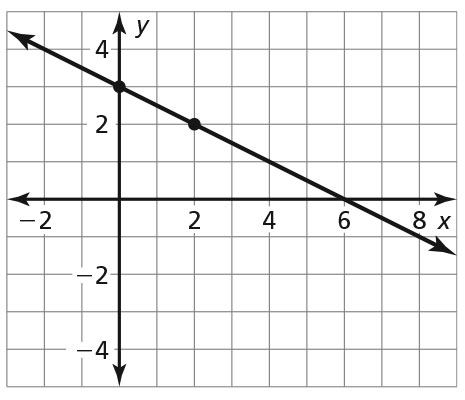
x-intercept: 6 -
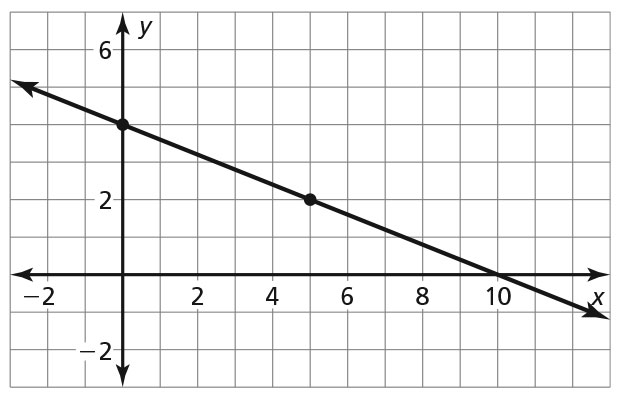
slope: ; y-intercept: 4; x-intercept: 10
Texas Tech K-12
-
Address
Texas Tech Plaza | 1901 University Ave, Lubbock, TX 79401 -
Phone
(800) 692-6877 -
Email
ttuk12@ttu.edu