
Section 5-7: Systems of Linear Inequalities (pages 259-266)
-
Demo Course

- TTU K-12 Demo Courses
Section 5-7: Systems of Linear Inequalities (pages 259-266)
Understanding Mathematical Terms
Refer to the English-Spanish Glossary, which starts on textbook page A39, if you need help with a definition or finding a textbook page with an example for a vocabulary word.
Explorations
Read and work through the Explorations 1 and 2 and Communicate Your Answer on page 259. To end this chapter, you will graph systems of linear inequalities. Then, check your answers below.
Answers to Explorations and Communicate Your Answer
Exploration 1 (page 259)
Inequality 1: A; the graph has a boundary line of y = –2x + 4.
Inequality 2: B; The graph has a boundary line of y = 2x.
Exploration 2 (page 259)
-
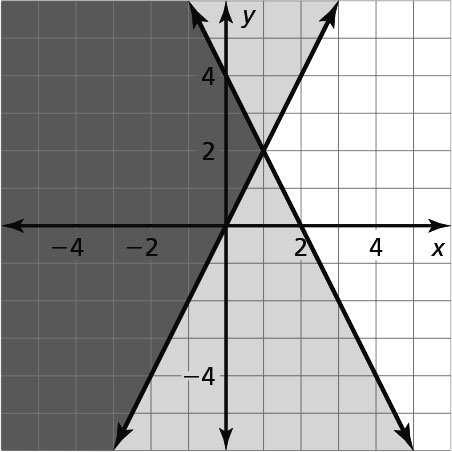
Parts of the two half-planes overlap. -
One shaded region is shaded only the first color, one shaded region is shaded only the second color, and one shaded region is shaded both colors; the values where both inequalities are false
Communicate Your Answer (page 259)
-
Graph each inequality in the same coordinate plane. Find the intersection of the half-planes that are solutions of the inequalities. This intersection is the graph of the system.
-
the region where the shaded half-planes of the inequalities overlap
-
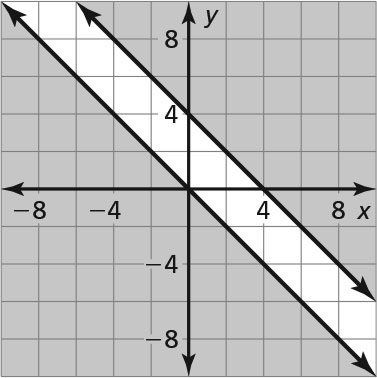
no; When the boundary lines are parallel, it is possible the shaded regions will not overlap.
-
x ≤ 2 and y ≤ 3
Section 5-7 Lesson (pages 260-263)
You may want to use colored pencils for this section when shading your graphs. It makes it easy to see the overlap. Read over and study Examples 1 through 6. When graphing more than three inequalities, and sometimes when you are only graphing two inequalities, the shading can make it difficult for you to see the solution. Work carefully. Practice with the Monitoring Progress problems as you go, and then check your answers below.
Answers to Monitoring Progress (pages 260-263)
- No
- Yes
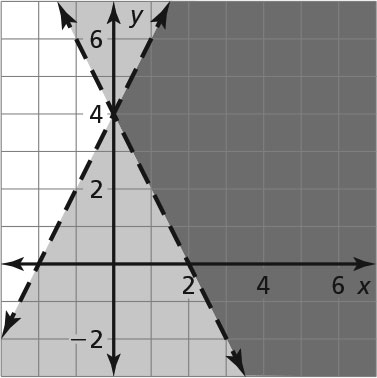
- y < –x + 2 and x < 3
-
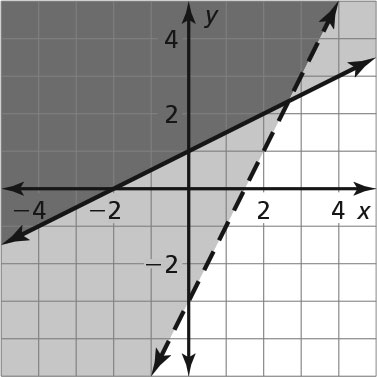
y ≥
 + 1 and y ≤ 2x – 3
 -
Sample answer: 3 hours at the mall, 4.5 hours at the beach
-
x ≥ 2 becomes x ≥ 3; no; 2.5 is not greater than 3.
Texas Tech K-12
-
Address
Texas Tech Plaza | 1901 University Ave, Lubbock, TX 79401 -
Phone
(800) 692-6877 -
Email
ttuk12@ttu.edu